
Concept explainers
Videos
(a)
To graph: The
(a)
Explanation of Solution
Given information:
The populations
| Year | Population, |
Graph:
To graph the points on scatter plot, follow the steps using graphing calculator.
First press the
Go to
Now, press the
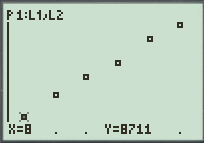
Figure (1)
(b)
To find: The linear model for the data with the help of regression of graphing utility.
(b)
Answer to Problem 23E
The linear model for the data is equal to
Explanation of Solution
Given information:
The populations
| Year | Population, |
Calculation:
For the regression linear model of data follow the steps below:
First press the
Go to
Now enter the keystrokes
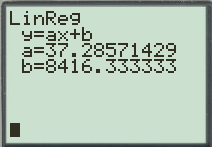
Figure(2)
Therefore, the linear model for the data is equal to
(c)
To find: The graph of model and the scatter plot of data in same viewing window and check the model is best fit or not.
(c)
Answer to Problem 23E
The model is best fit for the data as all the points of the data lies on the graph of the model.
Explanation of Solution
Given information:
The populations
| Year | Population, |
Calculation:
To graph the points on scatter plot, follow the steps using graphing calculator.
First press the
Go to
Now press the key
Now, press the
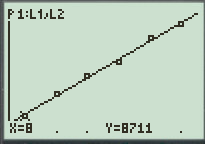
Figure (3)
(d)
To find: The table that shows the actual values of
(d)
Answer to Problem 23E
The table that shows the actual values of
| Year | Actual value of | Model value of |
Explanation of Solution
Given information:
The populations
| Year | Population, |
Calculation:
As found in part(b), the model for the best fit of data is equal to
Substitute
| Year | Actual value of | Model value of |
(e)
To find: The population of New Jersey in
(e)
Answer to Problem 23E
The population of New Jersey in
Explanation of Solution
Given information:
The populations
| Year | Population, |
Calculation:
As found in part(b), the model for the best fit of data is equal to
Substitute
Therefore, the population of New Jersey in
The answer to the population of New Jersey in
Chapter 1 Solutions
Precalculus with Limits: A Graphing Approach


- 3.12 (B). A horizontal beam AB is 4 m long and of constant flexural rigidity. It is rigidly built-in at the left-hand end A and simply supported on a non-yielding support at the right-hand end B. The beam carries Uniformly distributed vertical loading of 18 kN/m over its whole length, together with a vertical downward load of 10KN at 2.5 m from the end A. Sketch the S.F. and B.M. diagrams for the beam, indicating all main values. Cl. Struct. E.] CS.F. 45,10,376 KN, B.M. 186, +36.15 kNm.7arrow_forwardQize f(x) = x + 2x2 - 2 x² + 4x²² - Solve the equation using Newton Raphsonarrow_forward-b±√√b2-4ac 2a @4x²-12x+9=0 27 de febrero de 2025 -b±√√b2-4ac 2a ⑥2x²-4x-1=0 a = 4 b=-12 c=9 a = 2 b = 9 c = \ x=-42±√(2-4 (4) (9) 2(4)) X = (12) ±√44)-(360) 2(108) x = ±√ X = =±√√²-4(2) (1) 2() X = ±√ + X = X = + X₁ = = X₁ = X₁ = + X₁ = = =arrow_forward
- 3.9 (A/B). A beam ABCDE, with A on the left, is 7 m long and is simply supported at Band E. The lengths of the various portions are AB 1-5m, BC = 1-5m, CD = 1 m and DE : 3 m. There is a uniformly distributed load of 15kN/m between B and a point 2m to the right of B and concentrated loads of 20 KN act at 4 and 0 with one of 50 KN at C. (a) Draw the S.F. diagrams and hence determine the position from A at which the S.F. is zero. (b) Determine the value of the B.M. at this point. (c) Sketch the B.M. diagram approximately to scale, quoting the principal values. [3.32 m, 69.8 KNm, 0, 30, 69.1, 68.1, 0 kNm.]arrow_forward4. Verify that V X (aẢ) = (Va) XẢ + aV X Ả where Ả = xyz(x + y + 2) A and a = 3xy + 4zx by carrying out the detailed differentiations.arrow_forward3. For each of the arrow or quiver graphs shown below, determine analytically V°C and V X Č. From these analytical solutions, identify the extrema (+/-) and plot these points on the arrow graph. (a) C = −✰CosxSiny + ŷSinxCosy -π<ׂу<π Ty (b) C = −xSin2y + ŷCos2y x, y<π -π< (c) C = −xCosx + ŷSiny -π< x, y < πarrow_forward
- 7.10 (B/C). A circular flat plate of diameter 305 mm and thickness 6.35 mm is clamped at the edges and subjected to a Uniform lateral pressure of 345 kN/m². Evaluate: (a) the central deflection, (b) the position and magnitude of the maximum radial stress. C6.1 x 10 m; 149.2 MN/m².] 100 200arrow_forward3.15 (B). A beam ABCD is simply supported at B and C with ABCD=2m; BC 4 m. It carries a point load of 60 KN at the free end A, a Uniformly distributed load of 60 KN/m between B and C and an anticlockwise moment of 80 KN m in the plane of the beam applied at the free end D. Sketch and dimension the S.F. and B.M. diagrams, and determine the position and magnitude of the maximum bending moment. CEL.E.] CS.F. 60, 170, 70KN, B.M. 120, +120.1, +80 kNm, 120.1 kNm at 2.83 m to right of 8.7arrow_forward7.1 (A/B). A Uniform I-section beam has flanges 150 mm wide by 8 mm thick and a web 180 mm wide and 8 mm thick. At a certain section there is a shearing force of 120 KN. Draw a diagram to illustrate the distribution of shear stress across the section as a result of bending. What is the maximum shear stress? [86.7 MN/m².arrow_forward
- 1. Let Ả = −2x + 3y+42, B = - - 7x +lý +22, and C = −1x + 2y + 42. Find (a) Ả X B (b) ẢX B°C c) →→ Ả B X C d) ẢB°C e) ẢX B XC.arrow_forward3.13 (B). A beam ABC, 6 m long, is simply-supported at the left-hand end A and at B I'm from the right-hand end C. The beam is of weight 100 N/metre run. (a) Determine the reactions at A and B. (b) Construct to scales of 20 mm = 1 m and 20 mm = 100 N, the shearing-force diagram for the beam, indicating thereon the principal values. (c) Determine the magnitude and position of the maximum bending moment. (You may, if you so wish, deduce the answers from the shearing force diagram without constructing a full or partial bending-moment diagram.) [C.G.] C240 N, 360 N, 288 Nm, 2.4 m from A.]arrow_forward5. Using parentheses make sense of the expression V · VXVV · Å where Ả = Ã(x, y, z). Is the result a vector or a scaler?arrow_forward
 Calculus: Early TranscendentalsCalculusISBN:9781285741550Author:James StewartPublisher:Cengage Learning
 Thomas' Calculus (14th Edition)CalculusISBN:9780134438986Author:Joel R. Hass, Christopher E. Heil, Maurice D. WeirPublisher:PEARSON
 Calculus: Early Transcendentals (3rd Edition)CalculusISBN:9780134763644Author:William L. Briggs, Lyle Cochran, Bernard Gillett, Eric SchulzPublisher:PEARSON
 Calculus: Early TranscendentalsCalculusISBN:9781319050740Author:Jon Rogawski, Colin Adams, Robert FranzosaPublisher:W. H. Freeman
 Calculus: Early Transcendental FunctionsCalculusISBN:9781337552516Author:Ron Larson, Bruce H. EdwardsPublisher:Cengage Learning