
Concept explainers
Videos
The bar graph shows the average cost of tuition and fees at private four-year colleges in the United States.
Average Cost of Tuition and Fees at Private Four-Year U.S. Colleges
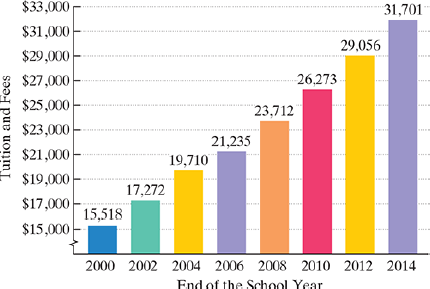
Source: The College Board
Here are two mathematical models for the data shown in the graph. In each formula, T represents the average cost of tuition and fees at private U.S. colleges for the school year ending x years after 2000.


Use this information to solve Exercises 67 – 68.
Use each model at the bottom of the previous page to find the average cost of tuition and fees at private U.S. colleges for the school year ending in 2012. By how much does each model underestimate or overestimate the actual cost shown for the school year ending in 2012?
b. Use model 1 to determine when tuition and fees at private four-year colleges will average $39,258.

Trending nowThis is a popular solution!

Chapter 1 Solutions
EBK INTERMEDIATE ALGEBRA FOR COLLEGE ST


- College students are graduating with the highest debt burden in history. The bar graph shows the mean, or average, student-loan debt in the United States for five selected graduating years from 2001 through 2013. Here are two mathematical models for the data shown by the graph. In each formula, D represents mean student-loan debt, in dollars, x years after 2000. The Model 1 is, D = 1188x + 16,218 and the Model 2 is D = 46x2 + 541x + 17,650. Solve, a. Which model better describes the data for 2001?b. Does the polynomial model of degree 2 underestimate or overestimate the mean student-loan debt for 2013? By how much?arrow_forwardThe boxplot below shows salaries for Actuaries and CPAs. CPA Actuary 30 40 50 60 70 Salary (thousands of $) + 80 90 100 Jacy makes the minimum salary for an Actuary. Dwayne makes the median salary for a CPA. Who makes more money? ○ Dwayne Jacy How much more? $arrow_forwardResearchers initiated a long-term study of the population of American black bears. One aspect of the study was to develop a model that could be used to predict a bear's weight (since it is not practical to weigh bears in the field). One variable thought to be related to weight is the length of the bear. The accompanying data represent the lengths and weights of 12 American black bears. Complete parts (a) through (d) below. Click the icon to view the data table. Click the icon to view the critical values table. ..... (a) Which variable is the explanatory variable based on the goals of the research? O A. The number of bears B. The weight of the bear O C. The length of the bear (b) Draw a scatter diagram of the data. Choose the correct graph below. O A. O B. O C. D. A Weight (kg) 180- AWeight (kg) 180- ALength (cm) 180- A Weight (kg) 180- 40- 100 40- 100 Length (cm) 40- 100 40- 100 200 200 200 200 Length (cm) Weight (kg) Length (cm) (c) Determine the linear correlation coefficient between…arrow_forward
- Rhonda took a ribbon which was originally 81 cm in length. She cut the ribbon in thirds and measured each piece, recording the data in the table at right. She continued to cut each piece of ribbon into thirds and record the lengths. Theoretically, how many cuts would it take to reach a length of about 0.037 cm for one piece of ribbon? L(n) Length of ribbon piece (cm) Number of cuts 81 1 27 3. O 6 O 7 O 8 23arrow_forwardThe boxplot below shows salaries for Actuaries and CPAs. Miguel makes the minimum salary for an Actuary. Ibram makes the median salary for a CPA.Who makes more money? Miguel Ibram How much more? $arrow_forwardPlease help with (d)arrow_forward
- As the new owner of a supermarket, you have inherited a large inventory of unsold imported Limburger cheese, and you would like to set the price so that your revenue from selling it is as large as possible. Previous sales figures of the cheese are shown in the following table. Price per Pound, p $3.00 $4.00 $5.00 Monthly Sales, q (pounds) 404 281 225 (a) Use the sales figures for the prices $4 and $5 per pound to construct a demand function of the formq = Ae-DP, where A and b are constants you must determine. (Round A and b to two significant digits.) q = (b) Use your demand function to find the price elasticity of demand at each of the prices listed. (Round your answers to two decimal places.) p = $3 E = p = $4 E = p = $5 E = (c) At what price should you sell the cheese to maximize monthly revenue? (Round your answer to the nearest cent.) (d) If your total inventory of cheese amounts to only 200 pounds and it will spoil one month from now, how should you price it to receive the…arrow_forwardDirection: Determine the diagram which would best present the data in the situation below. Then draw the diagram in the space provided to present the data. Make sure to add a title and a legend in the diagram. Situation: According to literacy reports in the city of Gotham, youth literacy went up to 7% since 2012. Here is the data: In 2010, only 43% of the youth population was literate. In the next census at 2015, it went up by 2%. After five years, the literacy rate was at 47%. During the most recent survey on 2020, the rate is already at 50%.arrow_forwardThe diversity index, from 0 to 100, measures the chance that two randomly selected people are a different race or ethnicity. The diversity index in the United States varies widely from region to region, from as high as 81 in Hawaii to as low as 11 in Vermont. The bar graph shows the national diversity index for the United States for four years in the period from 1980 through 2010.The data in the graph can be modeled by the formulaD = 0.005x2 + 0.55x + 34,where D is the national diversity index in the United States x years after 1980. According to the formula, what was the U.S. diversity index in 2010? How does this compare with the index displayed by the bar graph?arrow_forward
- Americans' trust in government and the media has generally been on a downward trend since pollsters first asked questions on these topics in the second half of the twentieth century. Trust in government hit an all-time low of 14% in 2014, while trust in the media bottomed out at 32% in 2016. The bar graph shows the percentage of Americans trusting in the government and the media for five selected years. Use this information to answer parts a-c. MERIT Percentage HHE + 70- 60 50- 40- TOR 30 20- 10 Trust in media Trust in Goverment 54 36 1625 32 47 More 43 20 19 39 a. Use the information in the graph to estimate the yearly loss in the percentage of people trusting in government. The yearly loss in the percentage of people trusting in government is 1.2%. (Round to the nearest tenth as needed.) b. Write a mathematical model that estimates the percentage, P, of people trusting in government x years after 2003. 17 The mathematical model P = estimates the percentage, P, of people trusting in…arrow_forwardA $3,640,000 B$1,820,000 C$4,200,000 D$910,000arrow_forwardWater Bills The Village of Oak Lawn charges homeowners$57.07 per quarter-year plus $5.81 per 1000 gallons for waterusage in excess of 10,000 gallons. In 2014 one homeowner’squarterly bill ranged from a high of $150.03 to a low of$97.74. Over what range did water usage vary?Source: Village of Oak Lawn, Illinois, January 2014arrow_forward
 Glencoe Algebra 1, Student Edition, 9780079039897...AlgebraISBN:9780079039897Author:CarterPublisher:McGraw Hill
 Elementary AlgebraAlgebraISBN:9780998625713Author:Lynn Marecek, MaryAnne Anthony-SmithPublisher:OpenStax - Rice University
 Big Ideas Math A Bridge To Success Algebra 1: Stu...AlgebraISBN:9781680331141Author:HOUGHTON MIFFLIN HARCOURTPublisher:Houghton Mifflin Harcourt
 Holt Mcdougal Larson Pre-algebra: Student Edition...AlgebraISBN:9780547587776Author:HOLT MCDOUGALPublisher:HOLT MCDOUGAL
 Algebra: Structure And Method, Book 1AlgebraISBN:9780395977224Author:Richard G. Brown, Mary P. Dolciani, Robert H. Sorgenfrey, William L. ColePublisher:McDougal Littell