
Concept explainers
To review:
The given blank space in the statement using the following ECG graph.
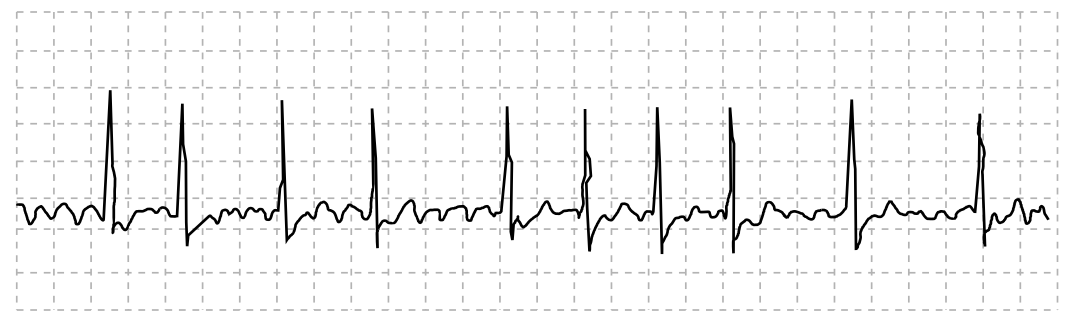
QRS duration: __________ QT duration: ____________
Ventricular rate and rhythm: _____________
Atrial rate rhythm: _____________________
PR interval: __________________________
Interpretation: ________________________
Introduction:
The process by which the heart rate of a patient is recorded is known as electrocardiography (ECG). The representation of this heart rate in a graph is called electrocardiogram. The electrical changes in the heart are detected by electrodes that are placed on the skin. The graph shows various components, such as P, Q, R, S, T, and U. These graphs are seen by doctors who interpret them in a systemic approach.

Trending nowThis is a popular solution!

Chapter 14 Solutions
Cardiopulmonary Anatomy & Physiology


- Put these steps of the control of blood pressure in the right order: ________________________ angiotensin I made by the liver ________________________ renin made by the kidney ________________________ juxtaglomerular apparatus indicates a blood pressure drop ________________________ angiotensin II made by the lungs ________________________ blood pressure rises ________________________adrenal cortex makes aldosteronearrow_forwardMatch the anatomic term in column II with its associated function in column I: Column I __________ 10. separates the right and left atria __________ 11. Located at the juncture of the superior vena cava and right atrium __________ 12. Supports the heart in the mediastinum __________ 13. Sits between the right ventricle and the pulmonary artery __________14. Distributes venous blood to the lungs __________15. Embedded in the right atrial wall near the tricuspid valve Column II a. Parietal pericardium b. Pulmonary artery c. Bicuspid Valve d. Pulmonic Valve e. Sinoatrial node f. Atrioventricular node g. Atrial Septumarrow_forwardChoose the letter of the correct answer. STATEMENT A B C D Arterial blood pressure is independent of Blood volume Heart rate Blood viscosity Influx of calcium ions Identify the TRUE statement(s). There may be several correct answers. An increased cardiac output is reflected in an elevated diastolic pressure. An increased cardiac output is reflected in a decreased diastolic pressure. An increase in the force of contraction produces an elevated systolic pressure. An increase in the force of ventricular contraction produces decreased diastolic pressure. In the absence of compensations, the stroke volume will decrease when Blood volume increases Venous return increases Contractility increases Arterial blood pressure increasesarrow_forward
- Number the following structures of the cardiac conduction system in the normal order of depolarization (1 to 5). _______________ AV bundle (of His) _______________ AV node _______________ Purkinje (conduction) fibers _______________ Right and left bundle branches _______________ SA nodearrow_forwardVentricular contraction occur during which segment/interval? Question options: P-wave QRS-complex T-wave P-R R-R S-T T-Parrow_forwardFill in the blank: Normally, the _______________________ node serves as the pacemaker of the heart.arrow_forward
- Below is an image of an electrocardiogram (EKG) tracing. What does "4" represent? 2 3 1 дел 4 P S T R nh LO 5arrow_forwardElectrocardiogram is also called ECG. It is a test that assesses the electrical activity of the heart through electrodes attached to the skin. The figure (A) on the X axis - represents the time and on the Y axis - the mV of an electrocardiogram. Image B represents the electrocardiogram of a rested adult patient. Based on the images, identify and comment on the diagnosis.arrow_forwardPlease do your own solution and dont copy paste from other posters answers. Draw a basic block diagram of oscillometric blood Pressure measurement setup and explain each block in the diagram in details.arrow_forward
- ____________ structures such as the ascending aorta are seen to the _____________ of the image while __________________ structures such as the descending aorta are seen to the __________ of the image.arrow_forwardLeft Side (dissected) Label the images below using the drag and drop text. Wall Left Ventricle Wall Right Ventricle Chordae Tendineae Papillary Musclearrow_forwardNOTES and the left side serving the systemic circuit. In Figure 16-15, complete the schematic showing the blood flow to and from the heart (the starting points are given to you). Use a blue pen or pencil to denote the direction of deoxygenated blood and a red pen or pencil for oxygenated blood flow. Include the names of the major vessels, chambers, and valves involved, based on the following list: lung capillary beds body capillary beds right ventricle left ventricle bicuspid valve superior vena cava tricuspid valve inferior vena cava pulmonary semilunar valve pulmonary trunk aortic semilunar valve R. and L. pulmonary arteries R. and L. pulmonary veins aorta Pulmonary Circulation Systemic Circulation Right atrium Left atrium URA--YCK HAT Lungs Body Figure 16-15. Schematic of circulationarrow_forward
