MATLAB: A Practical Introduction to Programming and Problem Solving
5th Edition
ISBN: 9780128154793
Author: Stormy Attaway Ph.D. Boston University
Publisher: Elsevier Science
expand_more
expand_more
format_list_bulleted
Concept explainers
Videos
Question
Chapter 14, Problem 14.1P
To determine
To find:
The minimum, maximum, arithmetic mean, variance,
Expert Solution & Answer
Answer to Problem 14.1P
Solution:
The required answers are stated as follows.
Explanation of Solution
MATLAB Code:
vector = [2 4 8 3 8];
minimum = min(vector)
maximum = max(vector)
mean_value = mean(vector)
variance_value = var(vector)
mode_value = mode(vector)
median_value = median(vector)
harmonic_mean = harmmean(vector)
geometric_mean = geomean(vector)
Save the MATLAB files with name, chapter14_54793_14_1P.m in the current folder. Execute the file by typing the name at the command window to generate output.
Result:
The result is,
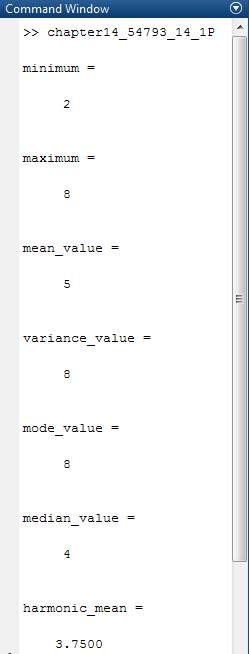
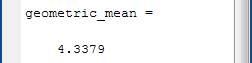
Therefore, the result is stated above.
Want to see more full solutions like this?
Subscribe now to access step-by-step solutions to millions of textbook problems written by subject matter experts!
Students have asked these similar questions
In the following augmented matrices x is a real parameter and they are obtained in the process of verifying if a vector b belongs to V = Gen{a1, a2, a3}.Indicate in each case how one should answer with respect to the following categories:
1) For every value of x the vector b does not belong to V.2) There is only one value of x for which vector b does not belong to V.3) There is only one value of x for which vector b belongs to V.4) For every value of x the vector b belongs to V.
a production line is producing light bulbs. 90% of the bulbs are good and .10% are defective. Suppose each bulbls condition is dependent of the other bulbs condition Select three buls at randon:
1. P(all 3 are good)=?
2. P( 2 of 3 are good)=
3. P(1 of 3 are good)=
A tea company appoints four salesmen A, B, C and D and observes their sales in three months, April, May and June: Months Salesmen A B C D April May June 36 28 26 36 29 28 21 31 29 35 32 29 2 For the two –way analysis of variance model with one observation per cell, we write the observation from the th j group and th i block as ij i j ijY µ β τ ε = + + + (a) Explain each term in the above model in the context of the given information. (b) Consider the observation on agent B and house 1 ( ) 21 28Y = i. Estimate µ ii. Estimate and interpret 2 β
Chapter 14 Solutions
MATLAB: A Practical Introduction to Programming and Problem Solving
Ch. 14 - Prob. 14.1PCh. 14 - Prob. 14.2PCh. 14 - Prob. 14.3PCh. 14 - Prob. 14.4PCh. 14 - Prob. 14.5PCh. 14 - Prob. 14.6PCh. 14 - Prob. 14.7PCh. 14 - Prob. 14.8PCh. 14 - Prob. 14.9PCh. 14 - Prob. 1E
Ch. 14 - Prob. 2ECh. 14 - Prob. 3ECh. 14 - Prob. 4ECh. 14 - Prob. 6ECh. 14 - Prob. 7ECh. 14 - Prob. 8ECh. 14 - Prob. 9ECh. 14 - Prob. 10ECh. 14 - Prob. 11ECh. 14 - Prob. 12ECh. 14 - Prob. 14ECh. 14 - Prob. 15ECh. 14 - Prob. 16ECh. 14 - Prob. 17ECh. 14 - Prob. 18ECh. 14 - Prob. 19ECh. 14 - Prob. 20ECh. 14 - Prob. 22ECh. 14 - Prob. 23ECh. 14 - Prob. 24ECh. 14 - Prob. 25ECh. 14 - Prob. 26ECh. 14 - Prob. 27ECh. 14 - Prob. 28ECh. 14 - Prob. 29ECh. 14 - Prob. 30ECh. 14 - Prob. 31ECh. 14 - Prob. 32ECh. 14 - Prob. 33ECh. 14 - Prob. 34ECh. 14 - Prob. 35ECh. 14 - Prob. 36ECh. 14 - Prob. 37ECh. 14 - Prob. 38ECh. 14 - Prob. 39ECh. 14 - Prob. 40ECh. 14 - Prob. 41ECh. 14 - Prob. 42ECh. 14 - Prob. 43ECh. 14 - Prob. 44ECh. 14 - Prob. 45ECh. 14 - Prob. 46ECh. 14 - Prob. 47E
Knowledge Booster


Learn more about
Need a deep-dive on the concept behind this application? Look no further. Learn more about this topic, statistics and related others by exploring similar questions and additional content below.Similar questions
- Find the least squares line for the following data points (using the orthogonal projection method): (−3, 4), (2, 2), (3, −4), (5, 0). Please don't cut or copyarrow_forwardWhich one of the following formulas represent the Generalized IV estimator (or two-stage least squares estimator)? (W'X)-1 W'y (X'X)-1 X'y (X'Ω-1X)-1 X'Ω-1y (X'PwX)-1 X'Pwy All of the above. None of the above.arrow_forwardA group of 11 students was selected at random and asked for their high school GPA and their freshmen GPA in college the subsequent year. The results were: Student High School GPA Freshmen GPA 1 2.0 1.6 2 2.2 2.0 3 2.6 1.8 4 2.7 2.8 5 2.8 2.1 6 3.1 2.0 7 2.9 2.6 8 3.2 2.2 9 3.3 2.6 10 3.6 3.0 We would like to know whether there is a linear relationship between the high school GPA and the college freshmen GPA, and we would like to be able to predict the freshmen GPA, if we know that the high school GPA of another student is, say, 3.4. Provide the two requested scatter plots for this data (put college freshman GPA on the Y (vertical) axis!). a) What would be your approximate 95% prediction interval for question (g)? b) Show your scatterplot with the predicted trend line belowarrow_forward
- For Even Roll Number (2)Write standard Basis of P4(x)?arrow_forwardAn online store contacts 15001500 customers from its list of customers who have purchased in the last year and asks the customers if they are very satisfied with the store’s website. One thousand (1000)(1000) customers respond, and 696696 of the 10001000 say that they are very satisfied with the store’s website. What is the parameter? The 69.6%69.6% of respondents who replied they are very satisfied with the store’s website. The percentage of the 15001500 customers contacted who would have replied they are very satisfied with the store’s website. The percentage of all customers who purchased in the last year who would have replied they are very satisfied with the store’s website. None of the choices represent the parameter.arrow_forwardFind the null space of the following matrix: A= [( 1,0,2,),(0,1,1),(0,0,0),(0,0,0)]arrow_forward
arrow_back_ios
arrow_forward_ios
Recommended textbooks for you
 Linear Algebra: A Modern IntroductionAlgebraISBN:9781285463247Author:David PoolePublisher:Cengage Learning
 Algebra & Trigonometry with Analytic GeometryAlgebraISBN:9781133382119Author:SwokowskiPublisher:Cengage
Linear Algebra: A Modern Introduction
Algebra
ISBN:9781285463247
Author:David Poole
Publisher:Cengage Learning
Algebra & Trigonometry with Analytic Geometry
Algebra
ISBN:9781133382119
Author:Swokowski
Publisher:Cengage
The Shape of Data: Distributions: Crash Course Statistics #7; Author: CrashCourse;https://www.youtube.com/watch?v=bPFNxD3Yg6U;License: Standard YouTube License, CC-BY
Shape, Center, and Spread - Module 20.2 (Part 1); Author: Mrmathblog;https://www.youtube.com/watch?v=COaid7O_Gag;License: Standard YouTube License, CC-BY
Shape, Center and Spread; Author: Emily Murdock;https://www.youtube.com/watch?v=_YyW0DSCzpM;License: Standard Youtube License