Managerial Accounting: Tools for Business Decision Making
7th Edition
ISBN: 9781118334331
Author: Jerry J. Weygandt, Paul D. Kimmel, Donald E. Kieso
Publisher: WILEY
expand_more
expand_more
format_list_bulleted
Videos
Textbook Question
Chapter 14, Problem 14.1AP
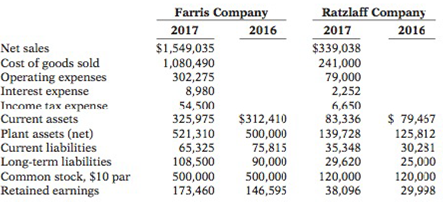
Comparative statement data for Farris Company and Ratzlaff Company, two competitors, appear below. All balance sheet data are as of December 31, 2017, and December 31, 2016.
Instructions
(a) Prepare a vertical analysis of the 2017 income statement data for Farris Company and Ratzlaff Company in columnar form.
(b) _______ Comment on the relative profitability of the companies by computing the return on assets and the return on common stockholders’ equity for both companies.
Expert Solution & Answer
Want to see the full answer?
Check out a sample textbook solution
Students have asked these similar questions
The condensed financial statements of John Cully Company, for the years ended June 30, 2017 and 2016, are presented below.
Compute the following ratios for 2017 and 2016.
Current ratio
Inventory turnover. (Inventory on 6/30/15 was $599.0.)
Profit margin.
Return on assets. (Assets on 6/30/15 were $3,349.9.)
Return on common stockholders’ equity. (Stockholders’ equity on 6/30/15 was $1,795.9.)
Debt to assets ratio.
Times interest earned.
A company’s comparative statements are given below. Please conduct the following analyses:
c. Calculate the three profitability ratios for year 2017 and show how ROE can be derived from the DuPont formula for this company.
d. What do the analyses tell you about the company’s financial performance?
A company’s comparative statements are given below. Please conduct the following analyses
(hint: use of a spreadsheet is recommended for ease of computation):a. Horizontal analysis (trend analysis) on the income statement
b. Vertical analysis (common size financial statement analysis) on the income statement
c. Calculate the three profitability ratios for the year 2017 and show how ROE can be derived from the DuPont formula for this company.
d. What do the analyses tell you about the company’s financial performance?
Chapter 14 Solutions
Managerial Accounting: Tools for Business Decision Making
Ch. 14 - (a) Jose Ramirez believes that the analysis of...Ch. 14 - (a) Distinguish among the following bases of...Ch. 14 - Prob. 3QCh. 14 - Prob. 4QCh. 14 - Prob. 5QCh. 14 - Prob. 6QCh. 14 - Prob. 7QCh. 14 - What do the following classes of ratios measure?...Ch. 14 - What is the difference between the current ratio...Ch. 14 - Hizar Company, a retail store, has an accounts...
Ch. 14 - Which ratios should be used to help answer the...Ch. 14 - The price-earnings ratio of General Motors...Ch. 14 - What is the formula for computing the payout...Ch. 14 - Holding all other factors constant, indicate...Ch. 14 - Prob. 15QCh. 14 - Prob. 16QCh. 14 - Prob. 17QCh. 14 - Prob. 18QCh. 14 - Prob. 19QCh. 14 - Why is it important to report discontinued...Ch. 14 - You are considering investing in Wingert...Ch. 14 - Prob. 22QCh. 14 - Prob. 23QCh. 14 - You recently received a letter from your Uncle...Ch. 14 - Prob. 14.2BECh. 14 - Using the following data from the comparative...Ch. 14 - Using the same data presented above in BE14-3 for...Ch. 14 - Net income was 500,000 in 2016, 450,000 in 2017,...Ch. 14 - Prob. 14.6BECh. 14 - Prob. 14.7BECh. 14 - Prob. 14.8BECh. 14 - Prob. 14.9BECh. 14 - Prob. 14.10BECh. 14 - The following data are taken from the financial...Ch. 14 - Prob. 14.12BECh. 14 - Prob. 14.13BECh. 14 - Prob. 14.14BECh. 14 - On June 30. Holloway Corporation discontinued its...Ch. 14 - Prob. 14.1DICh. 14 - Prob. 14.2DICh. 14 - In its proposed 2017 income statement. Hrabik...Ch. 14 - Financial information for Kurzen Inc. is presented...Ch. 14 - Operating data for Navarro Corporation are...Ch. 14 - The comparative condensed balance sheets of Gurley...Ch. 14 - The comparative condensed income statements of...Ch. 14 - Suppose Nordstrom, Inc., which operates department...Ch. 14 - Keener Incorporated had the following transactions...Ch. 14 - Frizell Company has the following comparative...Ch. 14 - Prob. 14.8ECh. 14 - Prob. 14.9ECh. 14 - Prob. 14.10ECh. 14 - Wiemers Corporations comparative balance sheets...Ch. 14 - Prob. 14.12ECh. 14 - Prob. 14.13ECh. 14 - Comparative statement data for Farris Company and...Ch. 14 - The comparative statements of Painter Tool Company...Ch. 14 - Prob. 14.3APCh. 14 - Financial information for Messersmith Company is...Ch. 14 - Prob. 14.5APCh. 14 - Prob. 14.6APCh. 14 - Prob. 14.7APCh. 14 - Prob. 14.8APCh. 14 - Prob. 14.9APCh. 14 - Financial Reporting Problem: Apple Inc. Your...Ch. 14 - PepsiCos financial statements are presented at...Ch. 14 - Prob. 14.3BYPCh. 14 - As the CPA for Gandara Manufacturing Inc., you...Ch. 14 - The Management Discussion and Analysis section of...Ch. 14 - Prob. 14.6BYPCh. 14 - Dave Schonhardt, president of Schonhardt...
Knowledge Booster


Learn more about
Need a deep-dive on the concept behind this application? Look no further. Learn more about this topic, accounting and related others by exploring similar questions and additional content below.Similar questions
- A Preparation of Ratios Refer to the financial statements for Burch Industries in Problem 12-89A and the following data. Required: 1. Prepare all the financial ratios for Burch for 2019 and 2018 (using percentage terms where appropriate and rounding all answers to two decimal places). 2. CONCEPTUAL CONNECTION Explain whether Burchs short-term liquidity is adequate. 3. CONCEPTUAL CONNECTION Discuss whether Burch uses its assets efficiently. 4. CONCEPTUAL CONNECTION Determine whether Burch is profitable. 5. CONCEPTUAL CONNECTION Discuss whether long-term creditors should regard Burch as a high-risk or a low-risk firm. 6. Perform a Dupont analysis (rounding to two decimal places) for 2018 and 2019.arrow_forwardProfitability Ratios Katrina Corp. is a publicly traded company on a large stock exchange. Katrinas financial statement for 2019 and 2018 included the following data: Required: Calculate Katrinas earnings per share as it would be reported on the 2019 income statement.arrow_forwardThe average liabilities, average stockholders' equity, and average total assets are as follows: 1. Determine the following ratios for both companies, rounding ratios and percentagesto one decimal place: a. Return on total assets b. Return on stockholders' equity c. Times interest earned d. Ratio of total liabilities to stockholders' equity 2. Based on the information in (1), analyze and compare the two companies'solvency and profitability. Comprehensive profitability and solvency analysis Marriott International, Inc., and Hyatt Hotels Corporation are two major owners and managers of lodging and resort properties in the United States. Abstracted income statement information for the two companies is as follows for a recent year (in millions): Balance sheet information is as follows:arrow_forward
- Here are comparative financial statement data for Oriole Company and Pharoah Company, two competitors. All data are as of December 31, 2022, and December 31, 2021. Compute the 2022 return assets and the return on common stockholders' equity for both companies.arrow_forwarda) Calculate the following ratios for 2016 and 2015, showing detailed calculations as to how you arrive at each number. A ROE B Gross profit margin C Total asset turnover D Inventory turnover E Current ratio F Debt-to-equity G Interest coverage ratio. b) Using the financial statements and the ratios calculated above (and any other ratios you like to calculate), discuss the performance of Cobham PLC in 2016. c) Critically discuss the need for the public limited companies to prepare a Statement of Cash Flows and explain the usefulness of the information contained therein from the perspective of a financial analyst.arrow_forwardBelow are the two basic financial statements of Chiz Trading Company. You are tasked to prepare an analysis using Horizontal and Vertical Analysis of their two-dated financial statements. In addition to this you have been tasked to prepare financial ratios measuring the company’s: Liquidity Status Current Ratios Quick Asset Ratios Efficiency Status Asset Turnover Fixed Asset Turnover Inventory Turnover Days in Inventory Accounts Receivable Turnover Days in Receivable Profitability Status: Gross Profit margin Ratio Operating Income Ratio Net Profit Ratio Return on Assets Return on Equityarrow_forward
- Comparative financial statement data for Blossom Company and Oriole Company, two competitors, appear below. All balance sheet data are as of December 31, 2022. Net sales. Cost of goods sold Operating expenses Interest expense Income tax expense Current assets Plant assets (net) Current liabilities Long-term liabilities Net cash common by operating activities Capital expenditures Dividends paid on common stock Weighted-average common shares outstanding Blossom Company Oriole Company 2022 Net Income $2,592,000 1,692,000 407,520 9,980 $ 122,500 496,600 766,000 95,500 157,020 198,720 129,600 51,840 80,000 2022 $892,800 489,600 141,120 4,240 51,840 213,840 201,160 (a) Compute the net income and earnings per share for each company for 2022. (Round Earnings per share to 2 decimal places, eg $2.78) Earnings per share 48,600 58,470 51,840 28,800 21,600 50,000arrow_forwardVII. Direction: Compute and interpret. The following comparative financial statements are provided by Avatar Industries. You were asked to compute the different financial ratios and provide your interpretations with regards to profitability, efficiency, liquidity and solvency of the company. Use the Answer Sheet template below to input your answer and solution. AVATAR INDUSTRIES AVATAR INDUSTRIES Comparative Statement of Financial Position For the years 2019 and 2018 Comparative Income Statement For the years 2019 and 2018 2019 2018 2019 2018 ASSETS Current Assets: Sales P200,000 P210,000 Cash & Cash Equivalent P65,000 P70,000 Sales Returns and Allowances 40,000 25,000 Accounts Receivable 40,000 35,000 Net Sales 160,000 185,000 Marketable Secuities 40,000 35,000 Cost of Goods Sold 100,000 115,625 Inventory 100,000 80,000 Gross Profit 60,000 69,375 Total Current Assets 220,000 200,000 160,000 P445,000 P380,000 245,000 Operating Expenses: Fixed Assets Selling Expenses 22,000 25,000 Total…arrow_forwardI need assistance on the following regarding the attached balance sheet and income statement: Required: a) Calculate the following financial ratios for 2016 and 2017 16. Earnings per share 17. Price-earnings ratio (Use year-end adjusted closing stock price of $57.32 for 2017 and $63.69 for 2016) 18. Dividend yield 19. Dividend payout ratioarrow_forward
- VII. Direction: Compute and interpret. The following comparative financial statements are provided by Avatar Industries. You were asked to compute the different financial ratios and provide your interpretations with regards to profitability, efficiency, liquidity and solvency of the company. Use the Answer Sheet template below to input your answer and solution. AVATAR INDUSTRIES AVATAR INDUSTRIES Comparative Statement of Financial Position For the years 2019 and 2018 Comparative Income Statement For the years 2019 and 2018 2019 2018 2019 2018 ASSETS Current Assets: Sales P200,000 P210,000 Cash & Cash Equivalent P65,000 P70,000 Sales Returns and Allowances 40,000 25,000 Accounts Receivable 40,000 35,000 Net Sales 160,000 185,000 Marketable Securities 40,000 35,000 Cost of Goods Sold 100,000 115,625 Inventory 100,000 80,000 Gross Profit 60,000 69,375 Total Current Assets 245,000 220,000 Operating Expenses: Fixed Assets 200,000 160,000 Selling Expenses 22,000 25,000 Total Assets P445,000…arrow_forwardYou are provided with the Income Statement and the Balance Sheet of HTS software, Inc. for 2011. Required: (b) Analyze the current financial position for the company from a time series and cross section viewpoint. (c) Break your analysis into an evaluation of the firm’s liquidity, activity, debt, profitability and market ratios. Historical and Industry Average Ratios HTS Software , Inc. Ratio 2010 2011 Industry2011 Current Ratio 2.6 2.08 2.7 Quick Ratio 1.8 1.32 1.75 Inventory Turnover 4.5 6 4.7 Average Collection Period 40days 9.125 42 days Total Asset Turnover 1.2 1.69 1 Debt Ratio 20% 28.2% 21% Times Interest Earned 9 5.9% 8.9 Gross Profit Margin 43% 42.8% 44% Operating Profit Margin 30% 25.5% 32% Net Profit Margin 20% 17% 21% Return on total assets 12% 4.11% 13% Return on Equity Price/Earnings Ratio 15% 7.3 19% 4.4 16% 8…arrow_forwardThe following condensed information is reported by Beany Baby Collectibles. Income Statement Information Sales revenue Cost of goods sold Net income Balance Sheet Information Current assets Long-term assets Total assets Current liabilities Long-term liabilities Common stock Retained earnings Total liabilities and stockholders' equity Required: 1. Calculate the following profitability ratios for 2024: 2. Determine the amount of dividends paid to shareholders in 2024. 2024 $10,440,000 6,827,760 360,000 $1,200,000 1,500,000 2023 $1,600,000 $1,500,000 2,200,000 1,900,000 $3,800,000 $3,400,000 800,000 300,000 $3,800,000 $8,400,000 5,900,000 248,000 $900,000 1,500,000 800,000 200,000 $3,400,000arrow_forward
arrow_back_ios
SEE MORE QUESTIONS
arrow_forward_ios
Recommended textbooks for you

 Cornerstones of Financial AccountingAccountingISBN:9781337690881Author:Jay Rich, Jeff JonesPublisher:Cengage Learning
 Financial AccountingAccountingISBN:9781337272124Author:Carl Warren, James M. Reeve, Jonathan DuchacPublisher:Cengage Learning
 Financial AccountingAccountingISBN:9781305088436Author:Carl Warren, Jim Reeve, Jonathan DuchacPublisher:Cengage Learning
 Financial Accounting: The Impact on Decision Make...AccountingISBN:9781305654174Author:Gary A. Porter, Curtis L. NortonPublisher:Cengage Learning
Cornerstones of Financial Accounting
Accounting
ISBN:9781337690881
Author:Jay Rich, Jeff Jones
Publisher:Cengage Learning
Financial Accounting
Accounting
ISBN:9781337272124
Author:Carl Warren, James M. Reeve, Jonathan Duchac
Publisher:Cengage Learning
Financial Accounting
Accounting
ISBN:9781305088436
Author:Carl Warren, Jim Reeve, Jonathan Duchac
Publisher:Cengage Learning
Financial Accounting: The Impact on Decision Make...
Accounting
ISBN:9781305654174
Author:Gary A. Porter, Curtis L. Norton
Publisher:Cengage Learning
Financial ratio analysis; Author: The Finance Storyteller;https://www.youtube.com/watch?v=MTq7HuvoGck;License: Standard Youtube License