
a)
The question requires us to identify the market structure.
a)
Explanation of Solution
The market with a single employer or single buyer of workers is known as the Monopsony market. This market is considered imperfect because the firm produces less than the perfectively competitive market and charges a higher price than the perfectively competitive market.
The Monopsony market is opposite to the
b)
The question requires us to draw a graph representing the labor market and correctly label the given variables.
b)
Explanation of Solution
The following diagram represents the Monopsony labor market:
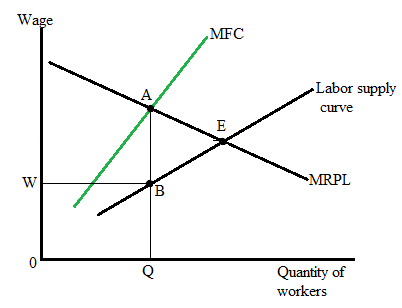
Here, the upward-sloping curve, MFC, represents the marginal factor cost curve of the firm, while the MRPL curve represents the marginal revenue product of the labor that also shows the firm's demand curve. The firm will decide the market wage (W) and the number of workers corresponding to the intersection of the MFC curve and the MRPL curve. The firm will hire the worker till point A. So, the equilibrium wage corresponding to point B is W*, and the
c)
The question requires us to draw a graph representing the labor market in a
c)
Explanation of Solution
The following diagram represents the equilibrium wage and equilibrium number of workers in the Monopsony market and in the perfectly competitive market:
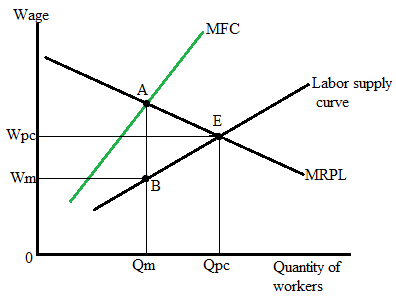
In a perfectively competitive
In the Monopsony market, the firm will give Wm wage to its workers and hire Qm workers at this wage.
If the firm is a monopsonist, it will hire fewer workers than the firms in the perfectly competitive market and it will provide lower wages to its workers than in the perfectly competitive workers.
Chapter 13R Solutions
Krugman's Economics For The Ap® Course


 Principles of Economics (12th Edition)EconomicsISBN:9780134078779Author:Karl E. Case, Ray C. Fair, Sharon E. OsterPublisher:PEARSON
 Engineering Economy (17th Edition)EconomicsISBN:9780134870069Author:William G. Sullivan, Elin M. Wicks, C. Patrick KoellingPublisher:PEARSON
 Principles of Economics (MindTap Course List)EconomicsISBN:9781305585126Author:N. Gregory MankiwPublisher:Cengage Learning
 Managerial Economics: A Problem Solving ApproachEconomicsISBN:9781337106665Author:Luke M. Froeb, Brian T. McCann, Michael R. Ward, Mike ShorPublisher:Cengage Learning
 Managerial Economics & Business Strategy (Mcgraw-...EconomicsISBN:9781259290619Author:Michael Baye, Jeff PrincePublisher:McGraw-Hill Education