
a)
The number of workers that Q&C would hire.
a)
Explanation of Solution
Price of toy airplane (P) = $100
Wage of worker (W) = $200
Rent per machine (R) = $400
Every profit-maximizing organization would try to recruit workers up to the point where their marginal revenue product of labor (MRPL) becomes equal to the wages they pay to their workers which means MRPL would equal to the Wage of the worker.
Therefore,
The marginal product labor is 2 and at this rate of marginal product of labor, the table corresponds to 5 workers which means the Q&C will hire 5 workers.
Introduction: The relationship between the price of an item or service and the quantity demanded over a specific time period is represented graphically by the demand curve and the supply curve shows the quantity, which is supplied at different prices in the market.
b)
Graph for Q&C that represents equilibrium wage rate and the number of hired workers.
b)
Explanation of Solution
The graph for the demand and supply curve for Q&C will be shown as:
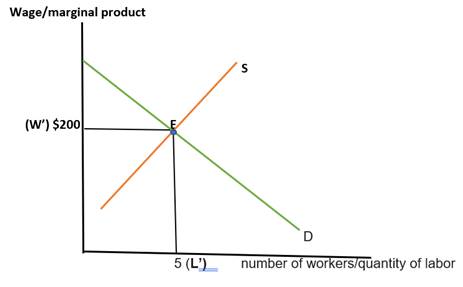
In the graph, the horizontal axis represents the number of workers and the vertical axis shows the wage of workers. In this case, Q&C is experiencing an equilibrium wage rate where supply and demand curves intersect or where supply is equal to the demand of workers. W’ label shows the equilibrium wage rate on the vertical axis, which is $200 and L’ represents the
Introduction: The relationship between the price of an item or service and the quantity demanded over a specific time period is represented graphically by the demand curve and the supply curve shows the quantity which is supplied at different prices in the market.
c)
The reason why the demand curve slopes as it does in this case.
c)
Explanation of Solution
The demand curve in this situation slopes downward. As more workers are hired, the marginal product of labor starts to decline, which leads to a decline in the marginal revenue product of labor as well. This is due to the law of diminishing returns which means the utility from labor or their marginal product is declining by increasing the number of workers for the firm.
Introduction: The relationship between the price of an item or service and the quantity demanded over a specific time period is represented graphically by the demand curve and the supply curve shows the quantity, which is supplied at different prices in the market.
d)
The graph that shows the effect of the decrease in the supply of workers in the industry.
d)
Explanation of Solution
The graph after the decrease in supply will be shown as:
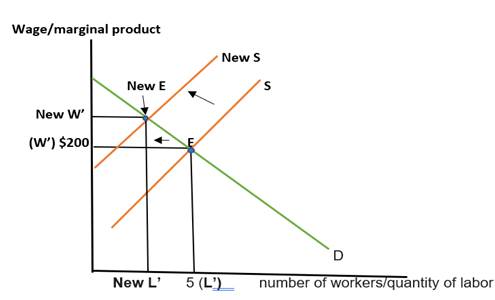
The more money an employee makes, the more hours they'll put in. The labor supply curve moves to the right as the labor supply grows and it will move to the left if it declines. Therefore, in this case, when the supply of labor is reduced, it shifts to the left as there would be a wage increase that leads them to work for long hours that in turn reduce the number of hired workers in the industry. New L’ is the new quantity of labor. New E is the new equilibrium and new W’ is the new equilibrium wage rate.
Introduction: The relationship between the price of an item or service and the quantity demanded over a specific time period is represented graphically by the demand curve and the supply curve shows the quantity which is supplied at different prices in the market.
Chapter 13R Solutions
Krugman's Economics For The Ap® Course


 Principles of Economics (12th Edition)EconomicsISBN:9780134078779Author:Karl E. Case, Ray C. Fair, Sharon E. OsterPublisher:PEARSON
 Engineering Economy (17th Edition)EconomicsISBN:9780134870069Author:William G. Sullivan, Elin M. Wicks, C. Patrick KoellingPublisher:PEARSON
 Principles of Economics (MindTap Course List)EconomicsISBN:9781305585126Author:N. Gregory MankiwPublisher:Cengage Learning
 Managerial Economics: A Problem Solving ApproachEconomicsISBN:9781337106665Author:Luke M. Froeb, Brian T. McCann, Michael R. Ward, Mike ShorPublisher:Cengage Learning
 Managerial Economics & Business Strategy (Mcgraw-...EconomicsISBN:9781259290619Author:Michael Baye, Jeff PrincePublisher:McGraw-Hill Education