
a)
The question requires us to draw a graph representing the labor market and hotel, and correctly label the given variables.
a)
Explanation of Solution
In a
The labor supply curve and demand curve in the market is relatively flatter than the individual firm’s curve. The following two graphs represent the:
- The labor market in the competitive market structure (left side diagram)
- Individual firm’s supply curve (right side diagram).
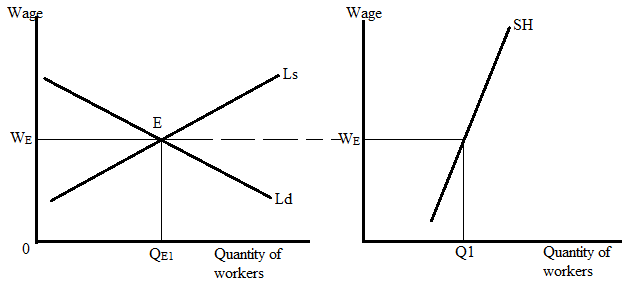
In the left side diagram, the intersection of the labor supply curve (Ls) and labor demand curve (Ld) shows the equilibrium in the market which is at point E, where
- WE are the equilibrium wage rate
- QE1 is the
equilibrium quantity of workers demanded and supplied in the labor market.
At the market wage, QE1 number of workers is available in the market. Thus, the firm will hire a proportion of the market supply of workers at the market wage.
Here, SH represents the supply curve of the hotel. At the given wage, the hotel will hire a Q1 number of workers.
b)
The question requires us to show the impact of a minimum wage on the labor market using the graph.
b)
Explanation of Solution
When the government sets a minimum wage above the equilibrium wage, the labor market will face a surplus of workers. At the higher wage, more people will prefer to work, but at the same time, the hotel will lower the demand for the workers as higher wage increases the costs of production. The following graph shows the impact of a minimum wage on the labor market.
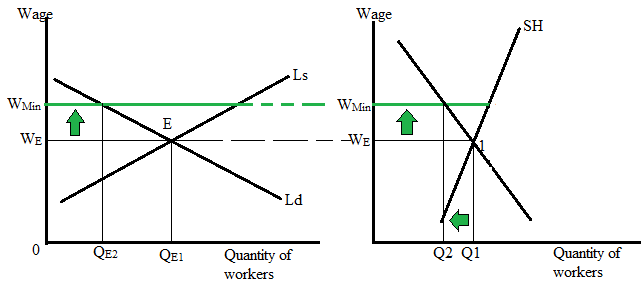
Due to a minimum wage policy,
- At this higher wage, the labor market will demand
- At this higher wage, the labor market will hire
Chapter 13R Solutions
Krugman's Economics For The Ap® Course


 Principles of Economics (12th Edition)EconomicsISBN:9780134078779Author:Karl E. Case, Ray C. Fair, Sharon E. OsterPublisher:PEARSON
 Engineering Economy (17th Edition)EconomicsISBN:9780134870069Author:William G. Sullivan, Elin M. Wicks, C. Patrick KoellingPublisher:PEARSON
 Principles of Economics (MindTap Course List)EconomicsISBN:9781305585126Author:N. Gregory MankiwPublisher:Cengage Learning
 Managerial Economics: A Problem Solving ApproachEconomicsISBN:9781337106665Author:Luke M. Froeb, Brian T. McCann, Michael R. Ward, Mike ShorPublisher:Cengage Learning
 Managerial Economics & Business Strategy (Mcgraw-...EconomicsISBN:9781259290619Author:Michael Baye, Jeff PrincePublisher:McGraw-Hill Education