Concept explainers
To Draw:A set of data and histogram.
Answer to Problem 13HP

Explanation of Solution
Given: Create a set of data that when plotted on a histogram has a gap between
As given
There is a gap between
Three item in
The median value in the
Using the data
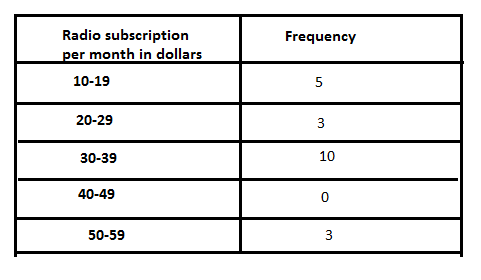
The frequency table of Radio subscription in dollars per month is shown below.

Now
Using the frequency table shown above
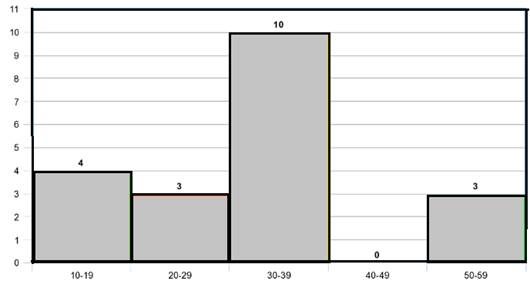
The histogram is given as

Chapter 13 Solutions
Pre-Algebra Student Edition
Additional Math Textbook Solutions
A Problem Solving Approach To Mathematics For Elementary School Teachers (13th Edition)
Algebra and Trigonometry (6th Edition)
Elementary Statistics (13th Edition)
Calculus: Early Transcendentals (2nd Edition)
Basic Business Statistics, Student Value Edition
- Schoology X 1. IXL-Write a system of X Project Check #5 | Schx Thomas Edison essay, x Untitled presentation ixl.com/math/algebra-1/write-a-system-of-equations-given-a-graph d.net bookmarks Play Gimkit! - Enter... Imported Imported (1) Thomas Edison Inv... ◄›) What system of equations does the graph show? -8 -6 -4 -2 y 8 LO 6 4 2 -2 -4 -6 -8. 2 4 6 8 Write the equations in slope-intercept form. Simplify any fractions. y = y = = 00 S olo 20arrow_forwardEXERCICE 2: 6.5 points Le plan complexe est rapporté à un repère orthonormé (O, u, v ).Soit [0,[. 1/a. Résoudre dans l'équation (E₁): z2-2z+2 = 0. Ecrire les solutions sous forme exponentielle. I b. En déduire les solutions de l'équation (E2): z6-2 z³ + 2 = 0. 1-2 2/ Résoudre dans C l'équation (E): z² - 2z+1+e2i0 = 0. Ecrire les solutions sous forme exponentielle. 3/ On considère les points A, B et C d'affixes respectives: ZA = 1 + ie 10, zB = 1-ie 10 et zc = 2. a. Déterminer l'ensemble EA décrit par le point A lorsque e varie sur [0, 1. b. Calculer l'affixe du milieu K du segment [AB]. C. Déduire l'ensemble EB décrit par le point B lorsque varie sur [0,¹ [. d. Montrer que OACB est un parallelogramme. e. Donner une mesure de l'angle orienté (OA, OB) puis déterminer pour que OACB soit un carré.arrow_forward2 Use grouping to factor: 10x + 13x + 3 = 0 Identify A B and C in the chart below feach responce inarrow_forward
- Name: Tay Jones Level Two Date: Algebra 3 Unit 3: Functions and Equations Practice Assessment Class: #7-OneNote 1. The function f(x) = x² is transformed in the following functions. List the vertex for each function, circle whether the function opens up or down, and why. All three parts must be correct to receive Level 2 points. You can receive points for a, b, and c. a) g(x) = -2(x+5)² Vertex: Opens Up Opens Down Why? ais negative -2 Vertex: b) g(x) = (x + 2)² - 3 c) g(x) = -4(x + 2)² + 2 Opens Up Opens Down Vertex: Opens Up Opens Down Why? 4 Ca is negative) Why? his positive 2. The graph of the function f(x) is shown below. Find the domain, range, and end behavior. Then list the values of x for which the function values are increasing and decreasing. f(x) Domain: End Behavior: As x → ∞o, f(x) -> -6 As x, f(x) -> Range: Where is it Increasing? (002] Where is it Decreasing? (1,00)arrow_forwardShow what to do on the graph visually please!arrow_forwardThe county's new asphalt paving machine can surface 1 km of highway in 10 h. A much older machine can surface 1 km in 18 h. How long will it take them to surface 21 km of highway if they start at opposite ends and work day and night?arrow_forward
- 3. Write a system of linear equations in slope intercept form that has exactly one solution at the point (3, 4), such that one line has positive slope (but not 1) and the other line has negative slope (but not "1). Also write your system of equations with both equations written in standard form with out any fractions 8- 7 8 5 4 3 -2- + -8-7-6-5-4-3-2-1 1 2 3 -1 2 - ° 4 -5 - -8arrow_forward2. Write a system of linear equations in slope-intercept form has exactly one solution at the point (3, 4), such that both lines have negative slope (but neither one has slope of 1). Also write your system of equations with both equations written in standard form without any fractions. B 0 5 4 3 -2 1 -8-7-6-5-4-3-2 -1 12 3 -1 2 -3 -5 6 -7 -8arrow_forward4. Write a system of linear equations in slope-intercept form that has no solution, such that (3, 4), and (3,8) are solutions to the first equation, and (0, 4) is a solution to the second equation. Also write your system of equations with both equations written in standard form with out any fractions B 0 5 4 3 -2 + -8-7-6-5-4-3-2 -1 |- 1 2 3 -1 2 -3 4 -5 6 -7arrow_forward
 Algebra and Trigonometry (6th Edition)AlgebraISBN:9780134463216Author:Robert F. BlitzerPublisher:PEARSON
 Contemporary Abstract AlgebraAlgebraISBN:9781305657960Author:Joseph GallianPublisher:Cengage Learning
 Linear Algebra: A Modern IntroductionAlgebraISBN:9781285463247Author:David PoolePublisher:Cengage Learning
 Algebra And Trigonometry (11th Edition)AlgebraISBN:9780135163078Author:Michael SullivanPublisher:PEARSON
 Introduction to Linear Algebra, Fifth EditionAlgebraISBN:9780980232776Author:Gilbert StrangPublisher:Wellesley-Cambridge Press
 College Algebra (Collegiate Math)AlgebraISBN:9780077836344Author:Julie Miller, Donna GerkenPublisher:McGraw-Hill Education


