
Elementary Statistics ( 3rd International Edition ) Isbn:9781260092561
3rd Edition
ISBN: 9781259969454
Author: William Navidi Prof.; Barry Monk Professor
Publisher: McGraw-Hill Education
expand_more
expand_more
format_list_bulleted
Concept explainers
Videos
Textbook Question
Chapter 13.3, Problem 14E
For the following data set:
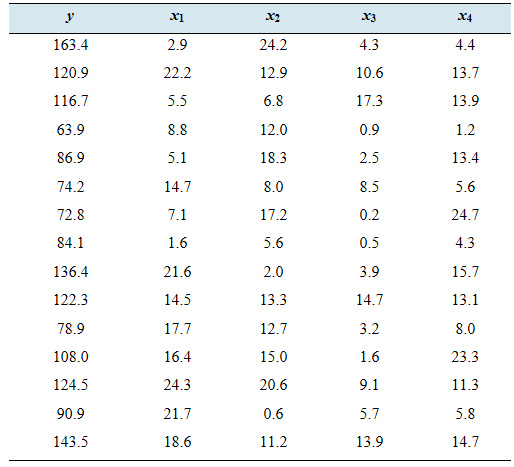
- Construct the multiple regression equation
- Predict the value of y when
- What percentage of the variation my is explained by the model?
- Is the model useful for prediction? Why or why not? Use the
- Test
Expert Solution & Answer
Want to see the full answer?
Check out a sample textbook solution
Students have asked these similar questions
create graph of the two-variable data with a regression line, r, r2, and separate residual plot
Find the equation of the regression line for the data based on time spend forstudying and current CGPA
The following table gives the data for the grades on the midterm exam and the grades on the final exam. Determine the equation of the regression line, yˆ=b0+b1x�^=�0+�1�. Round the slope and y-intercept to the nearest thousandth.
Grades on Midterm and Final Exams
Grades on Midterm
7171
6262
7878
9494
8383
8181
8080
9494
8585
6262
Grades on Final
8888
7979
8888
9191
8080
7070
7171
9393
6565
7777
Chapter 13 Solutions
Elementary Statistics ( 3rd International Edition ) Isbn:9781260092561
Ch. 13.1 - Prob. 7ECh. 13.1 - Prob. 8ECh. 13.1 - In Exercises 9 and 10, determine whether the...Ch. 13.1 - Prob. 10ECh. 13.1 - Prob. 11ECh. 13.1 - Prob. 12ECh. 13.1 - Prob. 13ECh. 13.1 - Prob. 14ECh. 13.1 - Prob. 15ECh. 13.1 - Prob. 16E
Ch. 13.1 - Prob. 17ECh. 13.1 - Prob. 18ECh. 13.1 - Prob. 19ECh. 13.1 - Prob. 20ECh. 13.1 - Prob. 21ECh. 13.1 - Prob. 22ECh. 13.1 - Prob. 23ECh. 13.1 - Prob. 24ECh. 13.1 - Prob. 25ECh. 13.1 - Prob. 26ECh. 13.1 - Prob. 27ECh. 13.1 - Prob. 28ECh. 13.1 - Prob. 26aECh. 13.1 - Calculator display: The following TI-84 Plus...Ch. 13.1 - Prob. 28aECh. 13.1 - Prob. 29ECh. 13.1 - Prob. 30ECh. 13.1 - Confidence interval for the conditional mean: In...Ch. 13.2 - Prob. 3ECh. 13.2 - Prob. 4ECh. 13.2 - Prob. 5ECh. 13.2 - Prob. 6ECh. 13.2 - Prob. 7ECh. 13.2 - Prob. 8ECh. 13.2 - Prob. 9ECh. 13.2 - Prob. 10ECh. 13.2 - Prob. 11ECh. 13.2 - Prob. 12ECh. 13.2 - Prob. 13ECh. 13.2 - Prob. 14ECh. 13.2 - Prob. 15ECh. 13.2 - Prob. 16ECh. 13.2 - Prob. 17ECh. 13.2 - Dry up: Use the data in Exercise 26 in Section...Ch. 13.2 - Prob. 19ECh. 13.2 - Prob. 20ECh. 13.2 - Prob. 21ECh. 13.3 - Prob. 7ECh. 13.3 - Prob. 8ECh. 13.3 - Prob. 9ECh. 13.3 - In Exercises 9 and 10, determine whether the...Ch. 13.3 - Prob. 11ECh. 13.3 - Prob. 12ECh. 13.3 - Prob. 13ECh. 13.3 - For the following data set: Construct the multiple...Ch. 13.3 - Engine emissions: In a laboratory test of a new...Ch. 13.3 - Prob. 16ECh. 13.3 - Prob. 17ECh. 13.3 - Prob. 18ECh. 13.3 - Prob. 19ECh. 13.3 - Prob. 20ECh. 13.3 - Prob. 21ECh. 13.3 - Prob. 22ECh. 13.3 - Prob. 23ECh. 13 - A confidence interval for 1 is to be constructed...Ch. 13 - A confidence interval for a mean response and a...Ch. 13 - Prob. 3CQCh. 13 - Prob. 4CQCh. 13 - Prob. 5CQCh. 13 - Prob. 6CQCh. 13 - Construct a 95% confidence interval for 1.Ch. 13 - Prob. 8CQCh. 13 - Prob. 9CQCh. 13 - Prob. 10CQCh. 13 - Prob. 11CQCh. 13 - Prob. 12CQCh. 13 - Prob. 13CQCh. 13 - Prob. 14CQCh. 13 - Prob. 15CQCh. 13 - Prob. 1RECh. 13 - Prob. 2RECh. 13 - Prob. 3RECh. 13 - Prob. 4RECh. 13 - Prob. 5RECh. 13 - Prob. 6RECh. 13 - Prob. 7RECh. 13 - Prob. 8RECh. 13 - Prob. 9RECh. 13 - Prob. 10RECh. 13 - Air pollution: Following are measurements of...Ch. 13 - Icy lakes: Following are data on maximum ice...Ch. 13 - Prob. 13RECh. 13 - Prob. 14RECh. 13 - Prob. 15RECh. 13 - Prob. 1WAICh. 13 - Prob. 2WAICh. 13 - Prob. 1CSCh. 13 - Prob. 2CSCh. 13 - Prob. 3CSCh. 13 - Prob. 4CSCh. 13 - Prob. 5CSCh. 13 - Prob. 6CSCh. 13 - Prob. 7CS
Knowledge Booster


Learn more about
Need a deep-dive on the concept behind this application? Look no further. Learn more about this topic, statistics and related others by exploring similar questions and additional content below.Similar questions
- Does Table 1 represent a linear function? If so, finda linear equation that models the data.arrow_forwardFind the equation of the regression line for the following data set. x 1 2 3 y 0 3 4arrow_forwardWhat is regression analysis? Describe the process of performing regression analysis on a graphing utility.arrow_forward
- The following table gives the data for the average temperature and the snow accumulation in several small towns for a single month. Determine the equation of the regression line, yˆ=b0+b1xy^=b0+b1x. Round the slope and y-intercept to the nearest thousandth. Then determine if the regression equation is appropriate for making predictions at the 0.010.01 level of significance. Average Temperatures and Snow Accumulations Average Temperature (℉℉) 38 30 17 39 45 22 34 24 29 38 Snow Accumulation (in.in.) 6 19 27 5 13 26 26 14 13 5 Copy Dataarrow_forwardThe following table gives the data for the average temperature and the snow accumulation in several small towns for a single month. Determine the equation of the regression line, yˆ=b0+b1xy^=b0+b1x. Round the slope and y-intercept to the nearest thousandth. Then determine if the regression equation is appropriate for making predictions at the 0.01 level of significance. Average Temperatures and Snow Accumulations Average Temperature (℉℉) 45 34 24 45 39 20 31 19 35 44 Snow Accumulation (in.in.) 9 16 24 9 15 28 25 18 16 5 1. Regression equation: y=__________ 2. Is the equation appropriate? yes or noarrow_forwardShow that the regression line that runs through the standardized data values has the formarrow_forward
- when a regression is used as a method of predicting dependent variables from one or more independent variables. How are the independent variables different from each other yet related to the dependent variable?arrow_forwardWould I use the regression line to predict Y from X ? And what is the pattern of the scatterplot?arrow_forwardThe following table gives the data for the grades on the midterm exam and the grades on the final exam. Determine the equation of the regression line, yˆ=b0+b1xy^=b0+b1x. Round the slope and y-intercept to the nearest thousandth. Grades on Midterm and Final Exams Grades on Midterm 78, 62, 75, 99, 80, 83, 74, 93, 80, 73 Grades on Final Exam 77, 78, 71, 95, 72, 84, 79, 84, 73, 80arrow_forward
- The data point height=175 cm, height =80 cm was misrecorded as height=145 cm, height =80 cm. If we use the simple linear regression and do not correct the mistake, what is the impact of this point on the model?arrow_forwardCalculate slope and intercept of the regression line.arrow_forwardFind the degrees of freedom in a regression model with an intercept term that has 88 observations and 7 explanatory variables.arrow_forward
arrow_back_ios
SEE MORE QUESTIONS
arrow_forward_ios
Recommended textbooks for you
 Functions and Change: A Modeling Approach to Coll...AlgebraISBN:9781337111348Author:Bruce Crauder, Benny Evans, Alan NoellPublisher:Cengage Learning
 Trigonometry (MindTap Course List)TrigonometryISBN:9781305652224Author:Charles P. McKeague, Mark D. TurnerPublisher:Cengage Learning
 Glencoe Algebra 1, Student Edition, 9780079039897...AlgebraISBN:9780079039897Author:CarterPublisher:McGraw Hill
 Algebra & Trigonometry with Analytic GeometryAlgebraISBN:9781133382119Author:SwokowskiPublisher:Cengage
 Algebra and Trigonometry (MindTap Course List)AlgebraISBN:9781305071742Author:James Stewart, Lothar Redlin, Saleem WatsonPublisher:Cengage Learning
Functions and Change: A Modeling Approach to Coll...
Algebra
ISBN:9781337111348
Author:Bruce Crauder, Benny Evans, Alan Noell
Publisher:Cengage Learning
Trigonometry (MindTap Course List)
Trigonometry
ISBN:9781305652224
Author:Charles P. McKeague, Mark D. Turner
Publisher:Cengage Learning
Glencoe Algebra 1, Student Edition, 9780079039897...
Algebra
ISBN:9780079039897
Author:Carter
Publisher:McGraw Hill
Algebra & Trigonometry with Analytic Geometry
Algebra
ISBN:9781133382119
Author:Swokowski
Publisher:Cengage
Algebra and Trigonometry (MindTap Course List)
Algebra
ISBN:9781305071742
Author:James Stewart, Lothar Redlin, Saleem Watson
Publisher:Cengage Learning
Correlation Vs Regression: Difference Between them with definition & Comparison Chart; Author: Key Differences;https://www.youtube.com/watch?v=Ou2QGSJVd0U;License: Standard YouTube License, CC-BY
Correlation and Regression: Concepts with Illustrative examples; Author: LEARN & APPLY : Lean and Six Sigma;https://www.youtube.com/watch?v=xTpHD5WLuoA;License: Standard YouTube License, CC-BY