Concept explainers
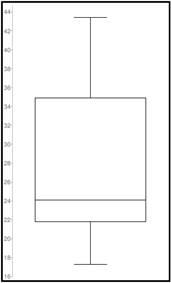
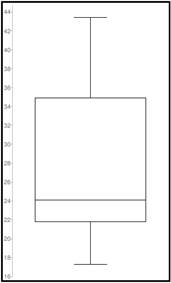
To Find: the lower and upper quartiles and sketch a box and whisper plot for the provided data.
Answer to Problem 40E
The required lower and upper quartiles are 21.8 and 34.9 respectively.
The box plot for the provided data set is:

Explanation of Solution
Given:
The provided data set is:
| 20.1 |
| 43.4 |
| 34.9 |
| 23.9 |
| 33.5 |
| 24.1 |
| 22.5 |
| 42.4 |
| 25.7 |
| 17.4 |
| 23.8 |
| 33.3 |
| 17.3 |
| 36.4 |
| 21.8 |
Formula used:
The formulas to compute the lower
Where, n is the number of observations.
Calculation:
Here n is 15
The lower and upper quartiles could be calculated as:
Similarly,
Thus, the required lower and upper quartiles are 21.8 and 34.9 respectively.
Graph:
The box plot for the provided data set can be constructed as:

Interpretation:
The above constructed box plot shows that the median is closer to the bottom of the plot which makes the distribution skewed to the right. It implies that the data has not been taken from the
Chapter 13 Solutions
EBK PRECALCULUS W/LIMITS
 Calculus: Early TranscendentalsCalculusISBN:9781285741550Author:James StewartPublisher:Cengage Learning
 Thomas' Calculus (14th Edition)CalculusISBN:9780134438986Author:Joel R. Hass, Christopher E. Heil, Maurice D. WeirPublisher:PEARSON
 Calculus: Early Transcendentals (3rd Edition)CalculusISBN:9780134763644Author:William L. Briggs, Lyle Cochran, Bernard Gillett, Eric SchulzPublisher:PEARSON
 Calculus: Early TranscendentalsCalculusISBN:9781319050740Author:Jon Rogawski, Colin Adams, Robert FranzosaPublisher:W. H. Freeman
 Calculus: Early Transcendental FunctionsCalculusISBN:9781337552516Author:Ron Larson, Bruce H. EdwardsPublisher:Cengage Learning


