
Concept explainers
Videos
(a)
To graph: A line plot for the given data is to be drawn.
(a)
Explanation of Solution
Given information: Data of first 20 states were admitted in Union in the following years:
Graph:
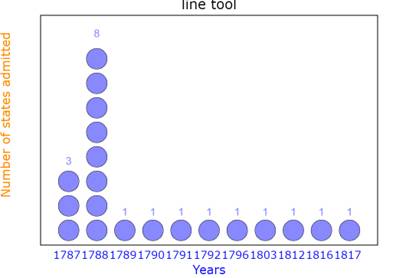
Interpretation:
A line plot shows that that maximum number of states admitted in year
(b)
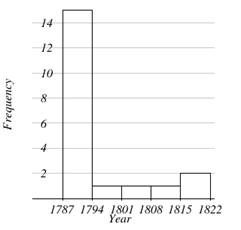
To graph: A frequency distribution for the given data is to be drawn.
(b)
Explanation of Solution
Given information: Data of first 20 states were admitted in Union in the following years:
Graph:
| Interval | Tally Marks | Frequency |
| 1787-1793 | |||| |||| |||| | 15 |
| 1794-1801 | | | 1 |
| 1802-1808 | | | 1 |
| 1809-1815 | | | 1 |
| 1816-1822 | || | 2 |
Interpretation:
Shows that that the least year is
(a)
To graph: A histogram for the given data is to be drawn.
(a)
Explanation of Solution
Given information: Data of first 20 states were admitted in Union in the following years:
Graph:
Interpretation:
Maximum numbers of states were admitted in year interval
(c)
To graph: A line plot for the given data is to be drawn.
(c)
Explanation of Solution
Given information: Data of ages of adult male passengers on the Mayflower at the time of its departure
Graph:
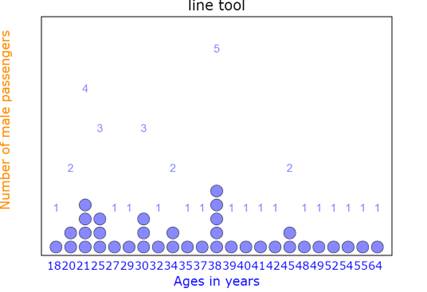
Interpretation: Out of all age groups, the maximum male adult passengers having age of 38 years have been departure.
(d)
To graph: A frequency distribution for the given data is to be drawn.
(d)
Explanation of Solution
Given information: Data of ages of adult male passengers on the Mayflower at the time of its departure
Graph:
| Interval | Tally Marks | Frequency |
| 18-27 | |||| |||| |||| | | 11 |
| 28-37 | |||| |||| | 9 |
| 38-47 | |||| |||| |||| | | 11 |
| 48-57 | |||| | 5 |
| 58-67 | | | 1 |
Interpretation: From above distribution we conclude that least age is 18 and greatest age is 64
e)
To graph: A histogram for the given data is to be drawn.
e)
Explanation of Solution
Given information: Data of ages of adult male passengers on the Mayflower at the time of its departure
Graph:
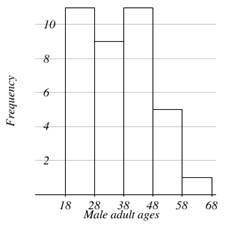
Interpretation: From above we conclude that maximum male adult passengers of age group under
e)
To graph: A histogram for the given data is to be drawn.
e)
Explanation of Solution
Given information: Data of ages of adult male passengers on the Mayflower at the time of its departure
Graph:
Interpretation: From above we conclude that maximum male adult passengers of age group under
Chapter 13 Solutions
EBK PRECALCULUS W/LIMITS


 Calculus: Early TranscendentalsCalculusISBN:9781285741550Author:James StewartPublisher:Cengage Learning
 Thomas' Calculus (14th Edition)CalculusISBN:9780134438986Author:Joel R. Hass, Christopher E. Heil, Maurice D. WeirPublisher:PEARSON
 Calculus: Early Transcendentals (3rd Edition)CalculusISBN:9780134763644Author:William L. Briggs, Lyle Cochran, Bernard Gillett, Eric SchulzPublisher:PEARSON
 Calculus: Early TranscendentalsCalculusISBN:9781319050740Author:Jon Rogawski, Colin Adams, Robert FranzosaPublisher:W. H. Freeman
 Calculus: Early Transcendental FunctionsCalculusISBN:9781337552516Author:Ron Larson, Bruce H. EdwardsPublisher:Cengage Learning