
Concept explainers
Videos
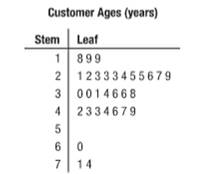
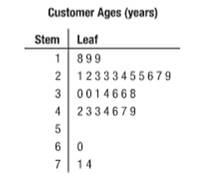
The correct option which shows range of ages of the given stem-and leaf plot:
A.
B.
C.
D.
Answer to Problem 3STP
The correct option is G. The range of ages is
Explanation of Solution
Given:
Concept Used:
The difference between the highest value and least value of the given data set is represented by the statistical term which is known as the range of data set
Calculation:
Range of ages of the given set data is calculated as:
Take the agesfrom the least to greatest:
The least value of age is:
The highest value of age is:
Now take subtraction both numbers:
Conclusion:
Hence,correct option is C.
Chapter 13 Solutions
Pre-Algebra, Student Edition
Additional Math Textbook Solutions
College Algebra in Context with Applications for the Managerial, Life, and Social Sciences (5th Edition)
College Algebra
Algebra and Trigonometry (6th Edition)
Elementary Algebra: Concepts and Applications (10th Edition)
Intermediate Algebra for College Students (7th Edition)


 Algebra and Trigonometry (6th Edition)AlgebraISBN:9780134463216Author:Robert F. BlitzerPublisher:PEARSON
 Contemporary Abstract AlgebraAlgebraISBN:9781305657960Author:Joseph GallianPublisher:Cengage Learning
 Linear Algebra: A Modern IntroductionAlgebraISBN:9781285463247Author:David PoolePublisher:Cengage Learning
 Algebra And Trigonometry (11th Edition)AlgebraISBN:9780135163078Author:Michael SullivanPublisher:PEARSON
 Introduction to Linear Algebra, Fifth EditionAlgebraISBN:9780980232776Author:Gilbert StrangPublisher:Wellesley-Cambridge Press
 College Algebra (Collegiate Math)AlgebraISBN:9780077836344Author:Julie Miller, Donna GerkenPublisher:McGraw-Hill Education