
Corporate Finance (4th Edition) (Pearson Series in Finance) - Standalone book
4th Edition
ISBN: 9780134083278
Author: Jonathan Berk, Peter DeMarzo
Publisher: PEARSON
expand_more
expand_more
format_list_bulleted
Concept explainers
Videos
Textbook Question
Chapter 13, Problem 2P
Assume that the
a. At current market prices, which stocks represent buying opportunities?
b. On which stocks should you put a sell order in?
Expert Solution & Answer
Want to see the full answer?
Check out a sample textbook solution
Students have asked these similar questions
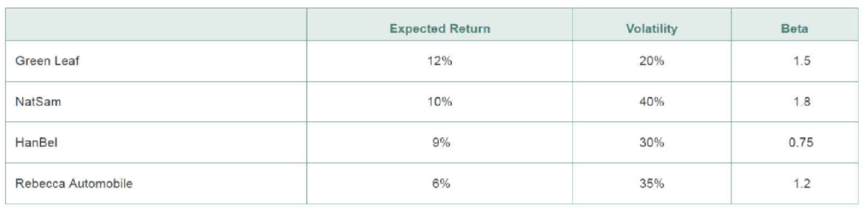
Assume that the CAPM is a good description of stock price returns. The market expected return is 7% with 11% volatility and the risk-free rate is 4% . New news arrives that does not change any of these numbers but it does change the expected return of the following stocks: a. At current market prices, which stocks represent buying opportunities?b. On which stocks should you put a sell order in?
2. Assume that the CAPM is a good description of stock price returns. The market expected return is 8% with 12% volatility
and the risk-free rate is 3.5%. New news arrives that does not change any of these numbers but it does change the
expected return of the following stocks: 1.
a. At current market prices, which stocks represent buying opportunities?
b. On which stocks should you put a sell order in?
Complete the table with the alphas below: (Round to one decimal place.)
Expected Return
Volatility
Beta
Alpha
Green Leaf
12%
20%
1.50
%
NatSam
10%
40%
1.80
%
HanBel
9%
30%
0.75
%
Rebecca Automobile
6%
35%
1.20
%
Consider an event study of the following stock.
Realised return
Market return
t = 0 (event day)
0.1
0.1
t =1
0.06
0.04
t = 2
0.03
0.02
t = 3
0.015
0.01
Suppose that the estimated market model is . What is the CAR (cumulative abnormal returns) for t = 3?
Chapter 13 Solutions
Corporate Finance (4th Edition) (Pearson Series in Finance) - Standalone book
Ch. 13.1 - If investors attempt to buy a stock with a...Ch. 13.1 - What is the consequence of investors exploiting...Ch. 13.2 - How can an uninformed or unskilled investor...Ch. 13.2 - Under what conditions will it be possible to earn...Ch. 13.3 - Do investors hold well-diversified portfolios?Ch. 13.3 - Why is the high trading volume observed in markets...Ch. 13.3 - What must be true about the behavior of small,...Ch. 13.4 - What are several systematic behavioral biases that...Ch. 13.4 - Prob. 2CCCh. 13.5 - Prob. 1CC
Ch. 13.5 - Prob. 2CCCh. 13.6 - Prob. 1CCCh. 13.6 - Prob. 2CCCh. 13.7 - Prob. 1CCCh. 13.7 - How can you use the Fama-French-Carhart factor...Ch. 13.8 - Which is the most popular method used by...Ch. 13.8 - Prob. 2CCCh. 13.8 - Prob. 3CCCh. 13 - Assume that all investors have the same...Ch. 13 - Assume that the CAPM is a good description of...Ch. 13 - Prob. 3PCh. 13 - Prob. 4PCh. 13 - Prob. 5PCh. 13 - Explain what the following sentence means: The...Ch. 13 - You are trading in a market in which you know...Ch. 13 - Prob. 8PCh. 13 - Your brother Joe is a surgeon who suffers badly...Ch. 13 - Prob. 11PCh. 13 - Suppose that all investors have the disposition...Ch. 13 - Prob. 14PCh. 13 - Prob. 15PCh. 13 - Prob. 16PCh. 13 - Prob. 17PCh. 13 - Prob. 18PCh. 13 - Each of the six firms in the table below is...Ch. 13 - Prob. 20PCh. 13 - In Problem 20, assume the risk-free rate is 3% and...Ch. 13 - Prob. 22PCh. 13 - Prob. 23PCh. 13 - Prob. 24PCh. 13 - Explain why if some investors are subject to...Ch. 13 - Prob. 26PCh. 13 - Prob. 27PCh. 13 - You are currently considering an investment in a...Ch. 13 - Prob. 29P
Knowledge Booster


Learn more about
Need a deep-dive on the concept behind this application? Look no further. Learn more about this topic, finance and related others by exploring similar questions and additional content below.Similar questions
- If a stock's expected return plots on or above the SML, then the stock's return is SML, the stock's return is to compensate the investor for risk. cent to compensate the investor for risk. If a stock's expected return plots below the The SML line can change due to expected Inflation and risk aversion. If inflation changes, then the SML plotted on a graph will shift up or down parallel to the old SML. If risk aversion changes, then the SML plotted on a graph will rotate up or down becoming more or less steep if investors become more or less risk averse. A firm can influence market risk (hence its beta coefficient) through changes in the composition of its assets and through changes in the amount of debt it uses. Quantitative Problem: You are given the following information for Wine and Cork Enterprises (WCE): Tar 4%; 10 % ; RPM 6%, and beta - 1.1 What is WCE's required rate of return? Do not round intermediate calculations. Round your answer to two decimal places. -75 % If inflation…arrow_forwardSuppose your expectations regarding the stock price are as follows: HPR (including dividends) State of the Market Boom Normal growth Recession Probability Ending Price 0.35 0.30 0.35 Mean Standard deviation Use the equations E (r) = Ep (s) r(s) and o² = Ep (s) [r(s) – E(r)]² to compute the mean and standard deviation of the HPR S S on stocks. Note: Do not round intermediate calculations. Round your answers to 2 decimal places. do do $ 140 110 80 % 44.5% 14.0 -16.5 %arrow_forwardAbnormal returns, if a stock has a(Alpha)=.004, b(Beta)=1.2, A. Using the market model (eq. 7.4), find the expected percent return if the market increases by 2%. B. If the actual return is 2%, 3%, or 4%, calculate the abnormal return.arrow_forward
- We know the following expected returns for stocks A and B, given the different states of the economy: State(s) Probability E(rA,s) E(rB,s) Recession 0.1-0.06 0.04 Normal 0.5 0.09 0.07 Expansion 0.4 0.17 0.11 What is the standard deviation of returns for stock B?arrow_forwardConsider the following information about Stocks I and II: Probability of State of Economy State of Rate of Return if State Occurs Economy Stock I Stock II Recession 0.15 0.20 -0.25 Normal 0.70 0.21 0.09 Irrational exuberance 0.15 0.06 0.44 The market risk premium is 7 percent, and the risk-free rate is 4 percent. a) Which stock has the most systematic risk? b) Which one has the most unsystematic risk? c) Which stock is "riskier"? Explain.arrow_forwardAssume that the risk-free rate remains constant, but the market risk premium declines. Which of the following is most likely to occur? a. The required return on a stock with beta = 1.0 will not change. b. The required return on a stock with beta > 1.0 will increase. c. The return on "the market" will increase. d. The return on "the market" will remain constant. e. The required return on a stock with a positive beta < 1.0 will decline.arrow_forward
- Stock HB has a beta of 1.5 and Stock LB has a beta of 0.5. The market is in equilibrium, with required returns equaling expected returns. Which of the following statements is CORRECT? a. If expected inflation remains constant but the market risk premium (rM – rRF) declines, the required return of Stock LB will decline but the required return of Stock HB will increase. b. If both expected inflation and the market risk premium (rM – rRF) increase, the required returns of both stocks will increase by the same amount. c. Since the market is in equilibrium, the required returns of the two stocks should be the same. d. If expected inflation remains constant but the market risk premium (rM – rRF) declines, the required return of Stock HB will decline but the required return of Stock LB will increase. e. If both expected inflation and the market risk premium (rM – rRF) increase, the required return on Stock HB will increase by…arrow_forwardSuppose your expectations regarding the stock price are as follows: State of the Market Boom Normal growth Recession. Probability Ending Price 0.30 $ 140 0.22 110 0.48 80 Mean Standard deviation. Use the equations E (r) = Ep (s) r(s) and o² = Ep (s) [r(s) - E(r)]² to compute the mean and standard deviation of the HPR on stocks. Note: Do not round intermediate calculations. Round your answers to 2 decimal places. HPR (including dividends) 55.5% 15.5 -14.0 % %arrow_forward(Expected rate of return and risk) Syntex, Inc. is considering an investment in one of two common stocks Given the information that filloors, which investment is better based on the risk (as measured by the standard deviation) and retum? Common Stock A Probability 0,20 0.60 0:20 Return 10% 17% 20% Common Stock B Probability 0.25 0.25 0.25 0.25 (Click on the icon in order to copy its contents into a spreadsheet) Return -6% 5% 16% 23% a. Given the information in the table, the expected rate of retum for stock Ais (Round to two decimal places)arrow_forward
- You've estimated the following expected returns for a stock, depending on the strength of the economy: State (s) Probability Expected return Recession 0.1 -0.05 Normal 0.5 0.06 Expansion 0.4 0.11 What is the expected return for the stock? What is the standard deviation of returns for the stock?arrow_forwardSuppose that many stocks are traded in the market and that it is possible to borrow at the risk-free rate, rƒ. The characteristics of two of the stocks are as follows: Stock Expected Return Standard Deviation A 8% 55% B 4% 45% Correlation = −1 Required: a. Calculate the expected rate of return on this risk-free portfolio? (Hint: Can a particular stock portfolio be formed to create a “synthetic” risk-free asset?) (Round your answer to 2 decimal places.) b. Could the equilibrium rƒ be greater than rate of return?arrow_forwardAssume the expected return on the market is 7 percent and the risk-free rate is 4 percent. a. What is the expected return for a stock with a beta equal to 1.10? (Enter your answers in decimals. Do not enter percent values.) b. What is the market risk premium? (Enter your answers in decimals. Do not enter percent values.)arrow_forward
arrow_back_ios
SEE MORE QUESTIONS
arrow_forward_ios
Recommended textbooks for you
 Essentials Of InvestmentsFinanceISBN:9781260013924Author:Bodie, Zvi, Kane, Alex, MARCUS, Alan J.Publisher:Mcgraw-hill Education,

 Foundations Of FinanceFinanceISBN:9780134897264Author:KEOWN, Arthur J., Martin, John D., PETTY, J. WilliamPublisher:Pearson,
 Fundamentals of Financial Management (MindTap Cou...FinanceISBN:9781337395250Author:Eugene F. Brigham, Joel F. HoustonPublisher:Cengage Learning
 Corporate Finance (The Mcgraw-hill/Irwin Series i...FinanceISBN:9780077861759Author:Stephen A. Ross Franco Modigliani Professor of Financial Economics Professor, Randolph W Westerfield Robert R. Dockson Deans Chair in Bus. Admin., Jeffrey Jaffe, Bradford D Jordan ProfessorPublisher:McGraw-Hill Education
Essentials Of Investments
Finance
ISBN:9781260013924
Author:Bodie, Zvi, Kane, Alex, MARCUS, Alan J.
Publisher:Mcgraw-hill Education,
Foundations Of Finance
Finance
ISBN:9780134897264
Author:KEOWN, Arthur J., Martin, John D., PETTY, J. William
Publisher:Pearson,
Fundamentals of Financial Management (MindTap Cou...
Finance
ISBN:9781337395250
Author:Eugene F. Brigham, Joel F. Houston
Publisher:Cengage Learning
Corporate Finance (The Mcgraw-hill/Irwin Series i...
Finance
ISBN:9780077861759
Author:Stephen A. Ross Franco Modigliani Professor of Financial Economics Professor, Randolph W Westerfield Robert R. Dockson Deans Chair in Bus. Admin., Jeffrey Jaffe, Bradford D Jordan Professor
Publisher:McGraw-Hill Education
Portfolio return, variance, standard deviation; Author: MyFinanceTeacher;https://www.youtube.com/watch?v=RWT0kx36vZE;License: Standard YouTube License, CC-BY