
Statistics for Engineers and Scientists
4th Edition
ISBN: 9780073401331
Author: William Navidi Prof.
Publisher: McGraw-Hill Education
expand_more
expand_more
format_list_bulleted
Concept explainers
Videos
Textbook Question
Chapter 1.3, Problem 14E
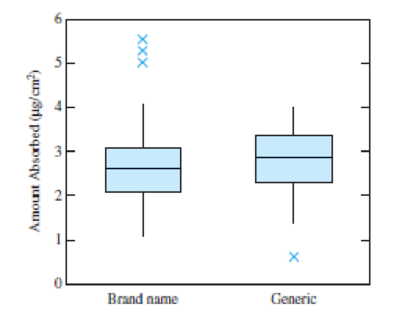
Following are boxplots comparing the amount of econozole nitrate (in µg/cm2) absorbed into skin for a brand name and a generic antifungal ointment (from the article "Improved Bioequivalence Assessment of Topical Dermatological Drug Products Using Dermatopharmacokinetics.” B. N’Dri-Stempfer, W. Navidi, R. Guy, and A. Bunge, Pharmaceutical Research, 2009:316–328).
True or false:
- a. The median amount absorbed for the brand name drug is greater than the 25th percentile of the amount absorbed for the generic drug.
- b. The median amount absorbed for the brand name drug is greater than the median amount absorbed for the generic drug.
- c. About half the sample values for the brand name drug are between 2 and 3.
- d. There is a greater proportion of values outside the box for the brand name drug than for the generic drug.
- e. Both samples are skewed to the right.
- f. Both samples contain outliers.
Expert Solution & Answer
Want to see the full answer?
Check out a sample textbook solution
Students have asked these similar questions
The authors of the paper "Statistical Methods for Assessing Agreement Between Two Methods of Clinical Measurement"† compared two different instruments for measuring a person's ability to breathe out air. (This measurement is helpful in diagnosing various lung disorders.) The two instruments considered were a Wright peak flow meter and a mini-Wright peak flow meter. Seventeen people participated in the study, and for each person air flow was measured once using the Wright meter and once using the mini-Wright meter.
Subject
Mini-WrightMeter
WrightMeter
Subject
Mini-WrightMeter
WrightMeter
1
512
494
10
445
433
2
430
395
11
432
417
3
520
516
12
626
656
4
428
434
13
260
267
5
500
476
14
477
478
6
600
557
15
259
178
7
364
413
16
350
423
8
380
442
17
451
427
9
658
650
(a)
Suppose that the Wright meter is considered to provide a better measure of air flow, but the mini-Wright meter is easier to transport and to use. If the two types of meters produce…
Following are boxplots comparing the amount of econozole nitrate (in ug/cm²) absorbed
into skin for a brand name and a generic antifungal ointment (from the article "Improved
Bioequivalence Assessment of Topical Dermatological Drug Products Using
Dermatopharmacokinetics." B. N Dri-Stempfer, W. Navidi, R. Guy, and A. Bunge,
Pharmaceutical Research, 2009:316-328).
Brand namr
Generic
True or false:
The median amount absorbed for the brand name drug is greater than the 25th
percentile of the amount absorbed for the generic drug.
b. The median amount absorbed for the brand name drug is greater than the median
amount absorbed for the generic drug.
About half the sample values for the brand name drug are between 2 and 3.
d. There is a greater proportion of values outside the box for the brand name drug than for
the generic drug.
Both samples are skewed to the right.
f. Both samples contain outliers.
a.
C.
e.
Amount Absorbed (ug/cm)
2.
The authors of the paper "Statistical Methods for Assessing Agreement Between Two Methods of Clinical Measurement" compared two different
instruments for measuring a subject's ability to breathe out air.† (This measurement is helpful in diagnosing various lung disorders.) The two
instruments considered were a Wright peak flow meter and a mini-Wright peak flow meter. Seventeen subjects participated in the study, and for
each subject air flow was measured once using the Wright meter and once using the mini-Wright meter.
Subject
1
2
3
4
5
6
7
8
9
Mini-
Wright
Meter
512
430
520
428
500
600
364
380
658
Wright
Meter
+
494
395
516
434
476
557
413
442
650
Subject
10
11
12
13
14
15
16
17
Mini-
Wright
Meter
445
432
626
260
477
259
350
451
Wright
Meter
433
417
656
267
478
178
423
427
(a) Suppose that the Wright meter is considered to provide a better measure of air flow, but the mini-Wright meter is easier to transport and to
use. If the two types of meters produce different readings but there is…
Chapter 1 Solutions
Statistics for Engineers and Scientists
Ch. 1.1 - Each of the following processes involves sampling...Ch. 1.1 - If you wanted to estimate the mean height of all...Ch. 1.1 - True or false: a. A simple random sample is...Ch. 1.1 - A sample of 100 college students is selected from...Ch. 1.1 - A certain process for manufacturing integrated...Ch. 1.1 - Refer to Exercise 5. True or false: a. If the...Ch. 1.1 - To determine whether a sample should be treated as...Ch. 1.1 - A medical researcher wants to determine whether...Ch. 1.1 - A medical researcher wants to determine whether...Ch. 1.2 - True or false: For any list of numbers, half of...
Ch. 1.2 - Is the sample mean always the most frequently...Ch. 1.2 - Is the sample mean always equal to one of the...Ch. 1.2 - Is the sample median always equal to one of the...Ch. 1.2 - Find a sample size for which the median will...Ch. 1.2 - For a list of positive numbers, is it possible for...Ch. 1.2 - Is it possible for the standard deviation of a...Ch. 1.2 - In a certain company, every worker received a...Ch. 1.2 - In another company, every worker received a 5%...Ch. 1.2 - A sample of 100 adult women was taken, and each...Ch. 1.2 - In a sample of 20 men, the mean height was 178 cm....Ch. 1.2 - Each of 16 students measured the circumference of...Ch. 1.2 - Refer to Exercise 12. a. If the measurements for...Ch. 1.2 - There are 10 employees in a particular division of...Ch. 1.2 - Quartiles divide a sample into four nearly equal...Ch. 1.2 - In each of the following data sets, tell whether...Ch. 1.3 - The weather in Los Angeles is dry most of the...Ch. 1.3 - Forty-five specimens of a certain type of powder...Ch. 1.3 - Refer to Table 1.2 (in Section 1.2). Construct a...Ch. 1.3 - Following are measurements of soil concentrations...Ch. 1.3 - A certain reaction was run several times using...Ch. 1.3 - Sketch a histogram for which a. The mean is...Ch. 1.3 - The figure below is a histogram showing the...Ch. 1.3 - The histogram below presents the compressive...Ch. 1.3 - Refer to Table 1.4 (in Section 1.3). a. Using the...Ch. 1.3 - Refer to Table 1.5 (in Section 1.3). a. Using the...Ch. 1.3 - The following table presents the number of...Ch. 1.3 - Which of the following statistics cannot be...Ch. 1.3 - A sample of 100 resistors has an average...Ch. 1.3 - Following are boxplots comparing the amount of...Ch. 1.3 - Following are summary statistics for two data...Ch. 1.3 - Match each histogram to the box plot that...Ch. 1.3 - Prob. 17ECh. 1.3 - Match each scatterplot to the statement that best...Ch. 1.3 - Prob. 19ECh. 1 - A vendor converts the weights on the packages she...Ch. 1 - Refer to Exercise 1. The vendor begins using...Ch. 1 - The specification for the pull strength of a wire...Ch. 1 - A coin is tossed twice and comes up heads both...Ch. 1 - The smallest number on a list is changed from 12.9...Ch. 1 - There are 15 numbers on a list, and the smallest...Ch. 1 - There are 15 numbers on a list, and the mean is...Ch. 1 - The article The Selection of Yeast Strains for the...Ch. 1 - Concerning the data represented in the following...Ch. 1 - True or false: In any boxplot, a. The length of...Ch. 1 - For each of the following histograms, determine...Ch. 1 - In the article Occurrence and Distribution of...Ch. 1 - The article Vehicle-Arrival Characteristics at...Ch. 1 - The cumulative frequency and the cumulative...Ch. 1 - The article Hydrogeochemical Characteristics of...Ch. 1 - Water scarcity has traditionally been a major...Ch. 1 - Prob. 18SECh. 1 - The article The Ball-on-Three-Ball Test for...
Knowledge Booster


Learn more about
Need a deep-dive on the concept behind this application? Look no further. Learn more about this topic, statistics and related others by exploring similar questions and additional content below.Similar questions
- The authors of the paper "Statistical Methods for Assessing Agreement Between Two Methods of Clinical Measurement" compared two different instruments for measuring a subject's ability to breathe out air.† (This measurement is helpful in diagnosing various lung disorders.) The two instruments considered were a Wright peak flow meter and a mini-Wright peak flow meter. Seventeen subjects participated in the study, and for each subject air flow was measured once using the Wright meter and once using the mini-Wright meter. Subject Mini-WrightMeter WrightMeter Subject Mini-WrightMeter WrightMeter 1 512 494 10 445 433 2 430 395 11 432 417 3 520 516 12 626 656 4 428 434 13 260 267 5 500 476 14 477 478 6 600 557 15 259 178 7 364 413 16 350 423 8 380 442 17 451 427 9 658 650 (a) Suppose that the Wright meter is considered to provide a better measure of air flow, but the mini-Wright meter is easier to transport and to use. If the two types of meters produce…arrow_forwardThe authors of the paper "Statistical Methods for Assessing Agreement Between Two Methods of Clinical Measurement" compared two different instruments for measuring a subject's ability to breathe out air.† (This measurement is helpful in diagnosing various lung disorders.) The two instruments considered were a Wright peak flow meter and a mini-Wright peak flow meter. Seventeen subjects participated in the study, and for each subject air flow was measured once using the Wright meter and once using the mini-Wright meter. Subject Mini-WrightMeter WrightMeter Subject Mini-WrightMeter WrightMeter 1 512 494 10 445 433 2 430 395 11 432 417 3 520 516 12 626 656 4 428 434 13 260 267 5 500 476 14 477 478 6 600 557 15 259 178 7 364 413 16 350 423 8 380 442 17 451 427 9 658 650 (a) Suppose that the Wright meter is considered to provide a better measure of air flow, but the mini-Wright meter is easier to transport and to use. If the two types of meters produce different readings but there is a…arrow_forwardThe authors of the paper "Statistical Methods for Assessing Agreement Between Two Methods of Clinical Measurement"† compared two different instruments for measuring a person's ability to breathe out air. (This measurement is helpful in diagnosing various lung disorders.) The two instruments considered were a Wright peak flow meter and a mini-Wright peak flow meter. Seventeen people participated in the study, and for each person air flow was measured once using the Wright meter and once using the mini-Wright meter. Subject Mini-WrightMeter WrightMeter Subject Mini-WrightMeter WrightMeter 1 512 494 10 445 433 2 430 395 11 432 417 3 520 516 12 626 656 4 428 434 13 260 267 5 500 476 14 477 478 6 600 557 15 259 178 7 364 413 16 350 423 8 380 442 17 451 427 9 658 650 (a) Suppose that the Wright meter is considered to provide a better measure of air flow, but the mini-Wright meter is easier to transport and to use. If the two types of meters produce different…arrow_forward
- Patients with rheumatoid arthritis are at a greater risk of developing osteoporosis. The reasons are not well understood due to the difficulty in qualitatively assessing bone metabolism and mineral content. A researcher measures human calcitonin (HCT) levels in men with rheumatoid arthritis. The researcher randomly selects 43 men with rheumatoid arthritis and measured the mean HCT level of 33.8 pg/mL. Assume that HCT for individuals with rheumatoid arthritis follows a normal distribution with standard deviation σ = 23.6 pg/mL. 5. What is the effect on the interval width if we decreased or increase the confidence level to 90% or 99% respectively? (Hint, create the intervals)arrow_forwardA county environmental agency suspects that the fish in a particular polluted lake have elevated mercury levels. To confirm that suspicion, five striped basses in that lake were caught and their tissues were tested for mercury. For the purpose of comparison, four striped basses in an unpolluted lake were also caught and tested. The fish tissue mercury levels in mg/kg are given below. Sample I(From Polluted Lake) 0.523 0.723 0.523 0.623 0.523 Sample II(From Unpolluted Lake) 0.323 0.223 0.523 0.323 0.000 (a) Construct the 95% confidence interval for the difference in the population means based on these data. (b) Test, at the 5% level of significance, whether the data provide sufficient evidence to conclude that fish in the polluted lake have elevated levels of mercury in their tissue.arrow_forwardPatients with rheumatoid arthritis are at a greater risk of developing osteoporosis. The reasons are not well understood due to the difficulty in qualitatively assessing bone metabolism and mineral content. A researcher measures human calcitonin (HCT) levels in men with rheumatoid arthritis. The researcher randomly selects 43 men with rheumatoid arthritis and measured the mean HCT level of 33.8 pg/mL. Assume that HCT for individuals with rheumatoid arthritis follows a normal distribution with standard deviation σ = 23.6 pg/mL. Determine the margin of error for HCT levels.arrow_forward
- Patients with rheumatoid arthritis are at a greater risk of developing osteoporosis. The reasons are not well understood due to the difficulty in qualitatively assessing bone metabolism and mineral content. A researcher measures human calcitonin (HCT) levels in men with rheumatoidarthritis. The researcher randomly selects 43 men with rheumatoid arthritis and measured the mean HCT level of 33.8 pg/mL. Assume that HCT for individuals with rheumatoid arthritis follows a normal distribution with standard deviation σ = 23.6 pg/mL. 4. Explain in detail what the 95% Confidence Interval for the mean HCT represents within this context.arrow_forwardPatients with rheumatoid arthritis are at a greater risk of developing osteoporosis. The reasons are not well understood due to the difficulty in qualitatively assessing bone metabolism and mineral content. A researcher measures human calcitonin (HCT) levels in men with rheumatoidarthritis. The researcher randomly selects 43 men with rheumatoid arthritis and measured the mean HCT level of 33.8 pg/mL. Assume that HCT for individuals with rheumatoid arthritis follows a normal distribution with standard deviation σ = 23.6 pg/mL. 3. Create a 95% confidence interval for the population mean HCT.arrow_forwardPatients with rheumatoid arthritis are at a greater risk of developing osteoporosis. The reasons are not well understood due to the difficulty in qualitatively assessing bone metabolism and mineral content. A researcher measures human calcitonin (HCT) levels in men with rheumatoidarthritis. The researcher randomly selects 43 men with rheumatoid arthritis and measured the mean HCT level of 33.8 pg/mL. Assume that HCT for individuals with rheumatoid arthritis follows a normal distribution with standard deviation σ = 23.6 pg/mL.1. For a 95% level of confidence what is the appropriate critical value Z*that needs to beused to calculate the margin of error? Determine the value of the critical value using a table or preferred technological tool.arrow_forward
- Patients with rheumatoid arthritis are at a greater risk of developing osteoporosis. The reasons are not well understood due to the difficulty in qualitatively assessing bone metabolism and mineral content. A researcher measures human calcitonin (HCT) levels in men with rheumatoidarthritis. The researcher randomly selects 43 men with rheumatoid arthritis and measured the mean HCT level of 33.8 pg/mL. Assume that HCT for individuals with rheumatoid arthritis follows a normal distribution with standard deviation σ = 23.6 pg/mL. 7. Describe a situation where a researcher would want to use a larger confidence level than 95% and a situation where a smaller confidence level would be preferred.arrow_forwardFoot ulcers are a common problem for people with diabetes. Higher skin temperatures on the foot indicate an increased risk of ulcers. The article "An Intelligent Insole for Diabetic Patients with the Loss of Protective Sensation" (Kimberly Anderson, M.S. Thesis, Colorado School of Mines), reports measurements of temperatures, in °F, of both feet for 181 diabetic patients. The results are presented in the following table. Left Foot Right Foot 80 80 85 85 75 80 88 86 89 87 87 82 78 78 88 89 89 90 76 81 89 86 87 82 78 78 80 81 87 82 86 85 76 80 88 89 Construct a scatterplot of the right foot temperature (y) versus the left foot temperature (x). Verify that a linear model is appropriate. b. Compute the least-squares line for predicting the right foot temperature from the left foot temperature. If the left foot temperatures of two patients differ by 2 degrees, by how much would you predict their right foot temperatures to differ? Predict the right foot temperature for a patient whose left…arrow_forwardThe authors of the paper "Statistical Methods for Assessing Agreement Between Two Methods of Clinical Measurement" compared two different instruments for measuring a subject's ability to breathe out air.+ (This measurement is helpful in diagnosing various lung disorders.) The two instruments considered were a Wright peak flow meter and a mini-Wright peak flow meter. Seventeen subjects participated in the study, and for each subject air flow was measured once using the Wright meter and once using the mini-Wright meter. Mini- Subject Wright Meter 1 2 3 4 5 6 7 8 9 512 430 520 428 500 600 364 380 658 Wright Meter 494 395 516 434 476 557 413 442 650 Subject 10 11 12 13 14 15 16 17 Mini- Wright Meter 445 432 626 260 477 259 350 451 Wright Meter 433 417 656 267 478 178 423 427 (a) Suppose that the Wright meter is considered to provide a better measure of air flow, but the mini-Wright meter is easier to transport and to use. If the two types of meters produce different readings but there is a…arrow_forward
arrow_back_ios
SEE MORE QUESTIONS
arrow_forward_ios
Recommended textbooks for you
 Glencoe Algebra 1, Student Edition, 9780079039897...AlgebraISBN:9780079039897Author:CarterPublisher:McGraw Hill
Glencoe Algebra 1, Student Edition, 9780079039897...
Algebra
ISBN:9780079039897
Author:Carter
Publisher:McGraw Hill
Correlation Vs Regression: Difference Between them with definition & Comparison Chart; Author: Key Differences;https://www.youtube.com/watch?v=Ou2QGSJVd0U;License: Standard YouTube License, CC-BY
Correlation and Regression: Concepts with Illustrative examples; Author: LEARN & APPLY : Lean and Six Sigma;https://www.youtube.com/watch?v=xTpHD5WLuoA;License: Standard YouTube License, CC-BY