
Statistics for Engineers and Scientists
4th Edition
ISBN: 9780073401331
Author: William Navidi Prof.
Publisher: McGraw-Hill Education
expand_more
expand_more
format_list_bulleted
Videos
Textbook Question
Chapter 1.3, Problem 8E
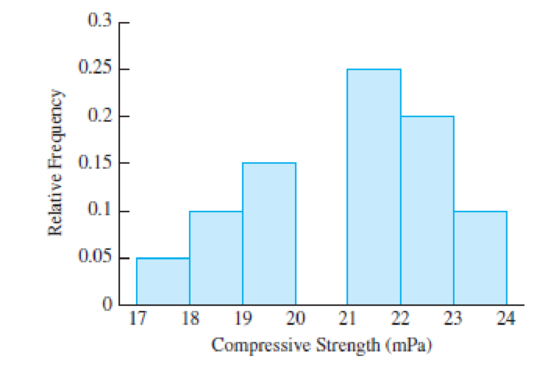
The histogram below presents the compressive strengths of a sample of concrete blocks hardened for 28 days. One rectangle from the histogram is missing. What is its height?
Expert Solution & Answer
Want to see the full answer?
Check out a sample textbook solution
Students have asked these similar questions
Consider the ceocomp dataset of compensation information for the CEO’s of 100 U.S. companies. We wish to fit aregression model to assess the relationship between CEO compensation in thousands of dollars (includes salary andbonus, but not stock gains) and the following variates:AGE: The CEOs age, in yearsEDUCATN: The CEO’s education level (1 = no college degree; 2 = college/undergrad. degree; 3 = grad. degree)BACKGRD: Background type(1= banking/financial; 2 = sales/marketing; 3 = technical; 4 = legal; 5 = other)TENURE: Number of years employed by the firmEXPER: Number of years as the firm CEOSALES: Sales revenues, in millions of dollarsVAL: Market value of the CEO's stock, in natural logarithm unitsPCNTOWN: Percentage of firm's market value owned by the CEOPROF: Profits of the firm, before taxes, in millions of dollars1) Create a scatterplot matrix for this dataset. Briefly comment on the observed relationships between compensationand the other variates.Note that companies with negative…
6 (Model Selection, Estimation and Prediction of GARCH) Consider the daily returns rt
of General Electric Company stock (ticker: "GE") from "2021-01-01" to "2024-03-31",
comprising a total of 813 daily returns. Using the "fGarch" package of R, outputs of
fitting three GARCH models to the returns are given at the end of this question.
Model 1 ARCH (1) with standard normal innovations;
Model 2
Model 3
GARCH (1, 1) with Student-t innovations;
GARCH (2, 2) with Student-t innovations;
Based on the outputs, answer the following questions.
(a) What can be inferred from the Standardized Residual Tests conducted on Model 1?
(b) Which model do you recommend for prediction between Model 2 and Model 3?
Why?
(c) Write down the fitted model for the model that you recommended in Part (b).
(d) Using the model recommended in Part (b), predict the conditional volatility in the
next trading day, specifically trading day 814.
4 (MLE of ARCH) Suppose rt follows ARCH(2) with E(rt) = 0,
rt = ut, ut =
στει, σε
where {+} is a sequence of independent and identically distributed (iid) standard normal
random variables.
With observations r₁,...,, write down the log-likelihood function for the model esti-
mation.
Chapter 1 Solutions
Statistics for Engineers and Scientists
Ch. 1.1 - Each of the following processes involves sampling...Ch. 1.1 - If you wanted to estimate the mean height of all...Ch. 1.1 - True or false: a. A simple random sample is...Ch. 1.1 - A sample of 100 college students is selected from...Ch. 1.1 - A certain process for manufacturing integrated...Ch. 1.1 - Refer to Exercise 5. True or false: a. If the...Ch. 1.1 - To determine whether a sample should be treated as...Ch. 1.1 - A medical researcher wants to determine whether...Ch. 1.1 - A medical researcher wants to determine whether...Ch. 1.2 - True or false: For any list of numbers, half of...
Ch. 1.2 - Is the sample mean always the most frequently...Ch. 1.2 - Is the sample mean always equal to one of the...Ch. 1.2 - Is the sample median always equal to one of the...Ch. 1.2 - Find a sample size for which the median will...Ch. 1.2 - For a list of positive numbers, is it possible for...Ch. 1.2 - Is it possible for the standard deviation of a...Ch. 1.2 - In a certain company, every worker received a...Ch. 1.2 - In another company, every worker received a 5%...Ch. 1.2 - A sample of 100 adult women was taken, and each...Ch. 1.2 - In a sample of 20 men, the mean height was 178 cm....Ch. 1.2 - Each of 16 students measured the circumference of...Ch. 1.2 - Refer to Exercise 12. a. If the measurements for...Ch. 1.2 - There are 10 employees in a particular division of...Ch. 1.2 - Quartiles divide a sample into four nearly equal...Ch. 1.2 - In each of the following data sets, tell whether...Ch. 1.3 - The weather in Los Angeles is dry most of the...Ch. 1.3 - Forty-five specimens of a certain type of powder...Ch. 1.3 - Refer to Table 1.2 (in Section 1.2). Construct a...Ch. 1.3 - Following are measurements of soil concentrations...Ch. 1.3 - A certain reaction was run several times using...Ch. 1.3 - Sketch a histogram for which a. The mean is...Ch. 1.3 - The figure below is a histogram showing the...Ch. 1.3 - The histogram below presents the compressive...Ch. 1.3 - Refer to Table 1.4 (in Section 1.3). a. Using the...Ch. 1.3 - Refer to Table 1.5 (in Section 1.3). a. Using the...Ch. 1.3 - The following table presents the number of...Ch. 1.3 - Which of the following statistics cannot be...Ch. 1.3 - A sample of 100 resistors has an average...Ch. 1.3 - Following are boxplots comparing the amount of...Ch. 1.3 - Following are summary statistics for two data...Ch. 1.3 - Match each histogram to the box plot that...Ch. 1.3 - Prob. 17ECh. 1.3 - Match each scatterplot to the statement that best...Ch. 1.3 - Prob. 19ECh. 1 - A vendor converts the weights on the packages she...Ch. 1 - Refer to Exercise 1. The vendor begins using...Ch. 1 - The specification for the pull strength of a wire...Ch. 1 - A coin is tossed twice and comes up heads both...Ch. 1 - The smallest number on a list is changed from 12.9...Ch. 1 - There are 15 numbers on a list, and the smallest...Ch. 1 - There are 15 numbers on a list, and the mean is...Ch. 1 - The article The Selection of Yeast Strains for the...Ch. 1 - Concerning the data represented in the following...Ch. 1 - True or false: In any boxplot, a. The length of...Ch. 1 - For each of the following histograms, determine...Ch. 1 - In the article Occurrence and Distribution of...Ch. 1 - The article Vehicle-Arrival Characteristics at...Ch. 1 - The cumulative frequency and the cumulative...Ch. 1 - The article Hydrogeochemical Characteristics of...Ch. 1 - Water scarcity has traditionally been a major...Ch. 1 - Prob. 18SECh. 1 - The article The Ball-on-Three-Ball Test for...
Knowledge Booster


Learn more about
Need a deep-dive on the concept behind this application? Look no further. Learn more about this topic, statistics and related others by exploring similar questions and additional content below.Similar questions
- 5 (Moments of GARCH) For the GARCH(2,2) model rt = 0.2+0.25u1+0.05u-2 +0.30% / -1 +0.20% -2, find cov(rt). 0.0035 ut, ut = στει,στ =arrow_forwardDefinition of null hypothesis from the textbook Definition of alternative hypothesis from the textbook Imagine this: you suspect your beloved Chicken McNugget is shrinking. Inflation is hitting everything else, so why not the humble nugget too, right? But your sibling thinks you’re just being dramatic—maybe you’re just extra hungry today. Determined to prove them wrong, you take matters (and nuggets) into your own hands. You march into McDonald’s, get two 20-piece boxes, and head home like a scientist on a mission. Now, before you start weighing each nugget like they’re precious gold nuggets, let’s talk hypotheses. The average weight of nuggets as mentioned on the box is 16 g each. Develop your null and alternative hypotheses separately. Next, you weigh each nugget with the precision of a jeweler and find they average out to 15.5 grams. You also conduct a statistical analysis, and the p-value turns out to be 0.01. Based on this information, answer the following questions. (Remember,…arrow_forwardBusiness Discussarrow_forward
- Cape Fear Community Colle X ALEKS ALEKS - Dorothy Smith - Sec X www-awu.aleks.com/alekscgi/x/Isl.exe/10_u-IgNslkr7j8P3jH-IQ1w4xc5zw7yX8A9Q43nt5P1XWJWARE... Section 7.1,7.2,7.3 HW 三 Question 21 of 28 (1 point) | Question Attempt: 5 of Unlimited The proportion of phones that have more than 47 apps is 0.8783 Part: 1 / 2 Part 2 of 2 (b) Find the 70th The 70th percentile of the number of apps. Round the answer to two decimal places. percentile of the number of apps is Try again Skip Part Recheck Save 2025 Mcarrow_forwardHi, I need to sort out where I went wrong. So, please us the data attached and run four separate regressions, each using the Recruiters rating as the dependent variable and GMAT, Accept Rate, Salary, and Enrollment, respectively, as a single independent variable. Interpret this equation. Round your answers to four decimal places, if necessary. If your answer is negative number, enter "minus" sign. Equation for GMAT: Ŷ = _______ + _______ GMAT Equation for Accept Rate: Ŷ = _______ + _______ Accept Rate Equation for Salary: Ŷ = _______ + _______ Salary Equation for Enrollment: Ŷ = _______ + _______ Enrollmentarrow_forwardQuestion 21 of 28 (1 point) | Question Attempt: 5 of Unlimited Dorothy ✔ ✓ 12 ✓ 13 ✓ 14 ✓ 15 ✓ 16 ✓ 17 ✓ 18 ✓ 19 ✓ 20 = 21 22 > How many apps? According to a website, the mean number of apps on a smartphone in the United States is 82. Assume the number of apps is normally distributed with mean 82 and standard deviation 30. Part 1 of 2 (a) What proportion of phones have more than 47 apps? Round the answer to four decimal places. The proportion of phones that have more than 47 apps is 0.8783 Part: 1/2 Try again kip Part ی E Recheck == == @ W D 80 F3 151 E R C レ Q FA 975 % T B F5 10 の 000 园 Save For Later Submit Assignment © 2025 McGraw Hill LLC. All Rights Reserved. Terms of Use | Privacy Center | Accessibility Y V& U H J N * 8 M I K O V F10 P = F11 F12 . darrow_forward
- You are provided with data that includes all 50 states of the United States. Your task is to draw a sample of: 20 States using Random Sampling (2 points: 1 for random number generation; 1 for random sample) 10 States using Systematic Sampling (4 points: 1 for random numbers generation; 1 for generating random sample different from the previous answer; 1 for correct K value calculation table; 1 for correct sample drawn by using systematic sampling) (For systematic sampling, do not use the original data directly. Instead, first randomize the data, and then use the randomized dataset to draw your sample. Furthermore, do not use the random list previously generated, instead, generate a new random sample for this part. For more details, please see the snapshot provided at the end.) You are provided with data that includes all 50 states of the United States. Your task is to draw a sample of: o 20 States using Random Sampling (2 points: 1 for random number generation; 1 for random sample) o…arrow_forwardCourse Home ✓ Do Homework - Practice Ques ✓ My Uploads | bartleby + mylab.pearson.com/Student/PlayerHomework.aspx?homeworkId=688589738&questionId=5&flushed=false&cid=8110079¢erwin=yes Online SP 2025 STA 2023-009 Yin = Homework: Practice Questions Exam 3 Question list * Question 3 * Question 4 ○ Question 5 K Concluir atualização: Ava Pearl 04/02/25 9:28 AM HW Score: 71.11%, 12.09 of 17 points ○ Points: 0 of 1 Save Listed in the accompanying table are weights (kg) of randomly selected U.S. Army male personnel measured in 1988 (from "ANSUR I 1988") and different weights (kg) of randomly selected U.S. Army male personnel measured in 2012 (from "ANSUR II 2012"). Assume that the two samples are independent simple random samples selected from normally distributed populations. Do not assume that the population standard deviations are equal. Complete parts (a) and (b). Click the icon to view the ANSUR data. a. Use a 0.05 significance level to test the claim that the mean weight of the 1988…arrow_forwardsolving problem 1arrow_forward
- select bmw stock. you can assume the price of the stockarrow_forwardThis problem is based on the fundamental option pricing formula for the continuous-time model developed in class, namely the value at time 0 of an option with maturity T and payoff F is given by: We consider the two options below: Fo= -rT = e Eq[F]. 1 A. An option with which you must buy a share of stock at expiration T = 1 for strike price K = So. B. An option with which you must buy a share of stock at expiration T = 1 for strike price K given by T K = T St dt. (Note that both options can have negative payoffs.) We use the continuous-time Black- Scholes model to price these options. Assume that the interest rate on the money market is r. (a) Using the fundamental option pricing formula, find the price of option A. (Hint: use the martingale properties developed in the lectures for the stock price process in order to calculate the expectations.) (b) Using the fundamental option pricing formula, find the price of option B. (c) Assuming the interest rate is very small (r ~0), use Taylor…arrow_forwardDiscuss and explain in the picturearrow_forward
arrow_back_ios
SEE MORE QUESTIONS
arrow_forward_ios
Recommended textbooks for you
 Big Ideas Math A Bridge To Success Algebra 1: Stu...AlgebraISBN:9781680331141Author:HOUGHTON MIFFLIN HARCOURTPublisher:Houghton Mifflin Harcourt
 Glencoe Algebra 1, Student Edition, 9780079039897...AlgebraISBN:9780079039897Author:CarterPublisher:McGraw Hill
 College Algebra (MindTap Course List)AlgebraISBN:9781305652231Author:R. David Gustafson, Jeff HughesPublisher:Cengage Learning
Big Ideas Math A Bridge To Success Algebra 1: Stu...
Algebra
ISBN:9781680331141
Author:HOUGHTON MIFFLIN HARCOURT
Publisher:Houghton Mifflin Harcourt
Glencoe Algebra 1, Student Edition, 9780079039897...
Algebra
ISBN:9780079039897
Author:Carter
Publisher:McGraw Hill
College Algebra (MindTap Course List)
Algebra
ISBN:9781305652231
Author:R. David Gustafson, Jeff Hughes
Publisher:Cengage Learning
Hypothesis Testing using Confidence Interval Approach; Author: BUM2413 Applied Statistics UMP;https://www.youtube.com/watch?v=Hq1l3e9pLyY;License: Standard YouTube License, CC-BY
Hypothesis Testing - Difference of Two Means - Student's -Distribution & Normal Distribution; Author: The Organic Chemistry Tutor;https://www.youtube.com/watch?v=UcZwyzwWU7o;License: Standard Youtube License