
Concept explainers
Videos
a.
To find: a quadratic model for the given data using the regression feature of a graphing utility. Let x represent the year, with x =6 corresponding to 2006.
a.
Answer to Problem 73E
Quadratic model is
Explanation of Solution
Given information: The table shows the revenues y (in millions of dollars) for N from
2006 through 2015.
| Year | Revenue y |
| 2006 | 996.7 |
| 2007 | 1205.3 |
| 2008 | 1364.7 |
| 2009 | 1670.3 |
| 2010 | 2162.6 |
| 2011 | 3204.6 |
| 2012 | 3609.3 |
| 2013 | 4374.6 |
| 2014 | 5504.7 |
| 2015 | 6779.5 |
Calculation:
Let x represent the year, with x =6 corresponding to 2006.
| Year x | Revenue y |
| 6 | 996.7 |
| 7 | 1205.3 |
| 8 | 1364.7 |
| 9 | 1670.3 |
| 10 | 2162.6 |
| 11 | 3204.6 |
| 12 | 3609.3 |
| 13 | 4374.6 |
| 14 | 5504.7 |
| 15 | 6779.5 |
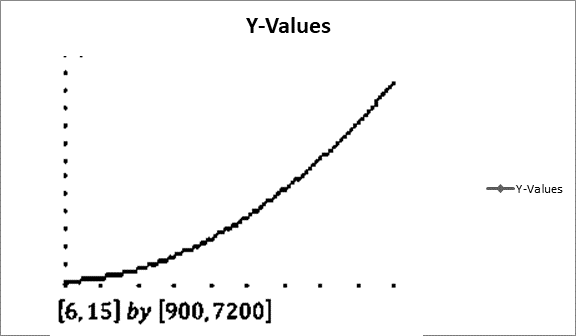
Using the graphing utility on above table data to find the model:
b.
To graph : the model found in part (a) using graphing utility and estimate the slope of the graph when x =10 and give an interpretation of the result.
b.
Answer to Problem 73E
This means that the rate of change in the revenue in 2010 was $566.1 million.
Explanation of Solution
Given information: The table shows the revenues y (in millions of dollars) for N from
2006 through 2015.
| Year | Revenue y |
| 2006 | 996.7 |
| 2007 | 1205.3 |
| 2008 | 1364.7 |
| 2009 | 1670.3 |
| 2010 | 2162.6 |
| 2011 | 3204.6 |
| 2012 | 3609.3 |
| 2013 | 4374.6 |
| 2014 | 5504.7 |
| 2015 | 6779.5 |
Calculation:
Quadratic model is
The graph of this model using graphing utility is shown below
The slope at x =10 is:
This means that the rate of change in the revenue in 2010 was $566.1 million.
c.
To graph: the tangent line to the model when x =10 using graphing utility. Compare the slope given by the graphing utility with the estimate in part (b).
c.
Answer to Problem 73E
The slop is the same as part (b).
Explanation of Solution
Given information: The table shows the revenues y (in millions of dollars) for N from
2006 through 2015.
| Year | Revenue y |
| 2006 | 996.7 |
| 2007 | 1205.3 |
| 2008 | 1364.7 |
| 2009 | 1670.3 |
| 2010 | 2162.6 |
| 2011 | 3204.6 |
| 2012 | 3609.3 |
| 2013 | 4374.6 |
| 2014 | 5504.7 |
| 2015 | 6779.5 |
Calculation:
The tangent line graph to the model when x =10 using graphing utility is shown below.
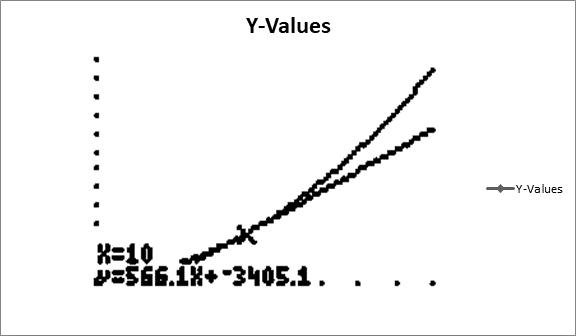
The slop is the same as part (b).
Chapter 12 Solutions
EBK PRECALCULUS W/LIMITS


 Calculus: Early TranscendentalsCalculusISBN:9781285741550Author:James StewartPublisher:Cengage Learning
 Thomas' Calculus (14th Edition)CalculusISBN:9780134438986Author:Joel R. Hass, Christopher E. Heil, Maurice D. WeirPublisher:PEARSON
 Calculus: Early Transcendentals (3rd Edition)CalculusISBN:9780134763644Author:William L. Briggs, Lyle Cochran, Bernard Gillett, Eric SchulzPublisher:PEARSON
 Calculus: Early TranscendentalsCalculusISBN:9781319050740Author:Jon Rogawski, Colin Adams, Robert FranzosaPublisher:W. H. Freeman
 Calculus: Early Transcendental FunctionsCalculusISBN:9781337552516Author:Ron Larson, Bruce H. EdwardsPublisher:Cengage Learning