
Concept explainers
Videos
Graph a table of values for the function
Answer to Problem 12E
1
Explanation of Solution
Given:
Concept Used:
When solving for limits, substitute values that are close to the value of
Calculation for graph:
Consider
| Values of x | Values of f ( x ) |
| -1.9 | 0.9090 |
| -1.99 | 0.9900 |
| -1.999 | 0.9990 |
| -2.001 | 1.0010 |
| -2.01 | 1.0101 |
By taking different values of x , the graph can be plotted.
The table shows that as
Graph:
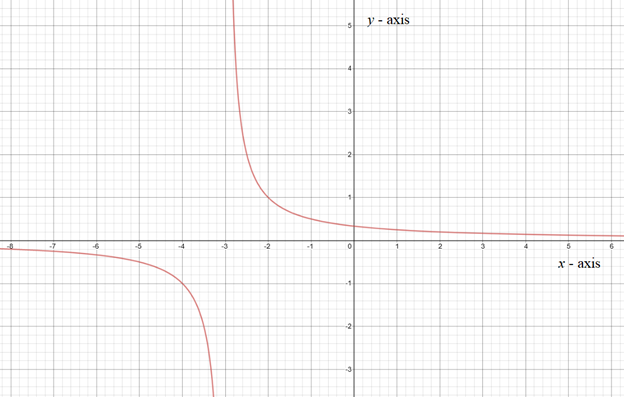
Interpretation:
The graph shows that as
Calculation:
Estimating the limit numerically,
Conclusion:
Therefore, when
Chapter 12 Solutions
EBK PRECALCULUS W/LIMITS


 Calculus: Early TranscendentalsCalculusISBN:9781285741550Author:James StewartPublisher:Cengage Learning
 Thomas' Calculus (14th Edition)CalculusISBN:9780134438986Author:Joel R. Hass, Christopher E. Heil, Maurice D. WeirPublisher:PEARSON
 Calculus: Early Transcendentals (3rd Edition)CalculusISBN:9780134763644Author:William L. Briggs, Lyle Cochran, Bernard Gillett, Eric SchulzPublisher:PEARSON
 Calculus: Early TranscendentalsCalculusISBN:9781319050740Author:Jon Rogawski, Colin Adams, Robert FranzosaPublisher:W. H. Freeman
 Calculus: Early Transcendental FunctionsCalculusISBN:9781337552516Author:Ron Larson, Bruce H. EdwardsPublisher:Cengage Learning