
Concept explainers
Videos
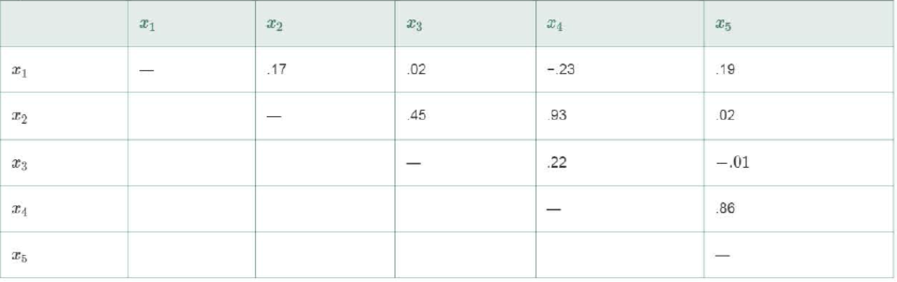
Consider fitting the multiple regression model
A matrix of
Want to see the full answer?
Check out a sample textbook solution
Chapter 12 Solutions
EBK STATISTICS FOR BUSINESS AND ECONOMI


- Suppose the Sherwin-Williams Company has developed the following multiple regression model, with paint sales Y (x 1,000 gallons) as the dependent variable and promotional expenditures A (x $1,000) and selling price P (dollars per gallon) as the independent variables. Y=α+βaA+βpP+εY=α+βaA+βpP+ε Now suppose that the estimate of the model produces following results: α=344.585α=344.585, ba=0.102ba=0.102, bp=−11.192bp=−11.192, sba=0.173sba=0.173, sbp=4.487sbp=4.487, R2=0.813R2=0.813, and F-statistic=11.361F-statistic=11.361. Note that the sample consists of 10 observations. 1.) According to the estimated model, holding all else constant, a $1,000 increase in promotional expenditures decrease or increase sales by approximately 102,813 or 11,192 gallons. Similarly, a $1 increase in the selling price decrease or increase sales by approximately 813,11,192 or 102 gallons. 2.)Which of the independent variables (if any) appears to be statistically significant (at the 0.05…arrow_forwardA. B. Consider data on births to women in the United States. Two variables of interest are the dependent variable, infant birth weight in ounces (bwght), and an explanatory variable, average number of cigarettes the mother smoked per day during pregnancy (cigs). The following simple regression was estimated using data on n = 1,388 births: bwght = 119.772 (0.572) n = 1,388, 0.514 cigs (0.091) R² = 0.0227, where standard errors are shown in parenthesis. What percent of the variation in birth weight is explained by cigs? What is the predicted birth weight when cigs = 0? What about when cigs = 20 (one pack per day)? Comment on the difference.arrow_forwardDefine coefficients of the Linear Regression Model?arrow_forward
- Being able to read regression results can help the manager use the information to make right decisions particularly in developing a marketing strategy. Assume that you are interested in finding whether the advertisement has a significant positive effect on sales. Which of the following is correct? A. lower standard errors of the estimates are better than higher standard errors B. as a rule of thumb, you are correct 95 % of the time in concluding that there is a positive and significant relationship between the advertising expenditures and sales if the coefficient attached to advertising expenditure is positive and the “t” value is at least 2 C. there is a positive significant relationship between advertising expenditure and sales if both the lower bound and the upper bound of the confidence interval are positive. D. the R2 shows the proportion of the variation in the sales as explained by the model which consists of the advertising expenditure plus some other determinants of sales…arrow_forwardDefine Interpretation of coefficients in polynomial regression models?arrow_forwardConsider the following regression model and corresponding output for a dataset with n = 104 observations: y=ß₁+ß2x2+ß³¸*¸+4 3 4x4+u Variable β Std. Error t P>|t| X2 -0.012 0.006 -2.289 0.022 X3 0.596 0.014 41.139 0.000 X4 0.52 1.06 Constant 8.860 1.766 5.017 0.000 What is the marginal effect of x4 on y? (approximate at least to 3 decimal places)arrow_forward
- Consider a data set with 15 observations and consider a multiple linear regression model with 7 in-dependent variables. Assume you have estimated the model and you find that SST = 1,325 and SSR = 794.arrow_forwardThe best way to interpret polynomial regressions is to: A. look at the t-statistics for the relevant coefficients. B. analyze the standard error of estimated effect. C. plot the estimated regression function and to calculate the estimated effect on Y associated with a change in X for one or more values of X. D. take a derivative of Y with respect to the relevant X.arrow_forward2. Consider a two variable regression model, which satisfies all the Gauss Markov assumptions except that the error variance is proportional to X² i.e.E(u?) = o²X? Y₁ = B₁ + B₂X₁ + Ui How would you obtain the best linear unbiased estimates from the above regression.arrow_forward
- True or False For a linear regression model including only an intercept, the OLS estimator of that intercept is equal to the sample mean of the independent variable.arrow_forwardIn the linear model ,E (X*u) = a)X*u b) 0 c) u d) none of tha abovearrow_forward10. Residual analysis Consider a regression of y on several independent variables, and the resulting predicted values of the dependent variable. The residual for the ith observation Consider a data set for a large sample of professional basketball players. Each observation contains the salary, as well as various performance statistics such as points, rebounds, and assists for each player. Suppose a regression of salary on all performance statistics is run, and the residuals are obtained. The player with the lowest (most negative) resid represents which of the following? (Assume the regression reasonably predicts salaries in most cases.) The most fairly paid player relative to her on-court performance The most overpaid player relative to her on-court performance The highest-paid player, regardless of her on-court performance The most underpaid player relative to her on-court performancearrow_forward
 Managerial Economics: Applications, Strategies an...EconomicsISBN:9781305506381Author:James R. McGuigan, R. Charles Moyer, Frederick H.deB. HarrisPublisher:Cengage Learning