
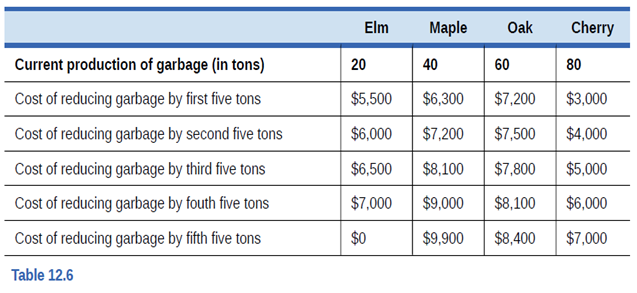
Four films called Elm, Maple, Oak, and (Shelly, produce wooden chairs. However, they also produce a great deal of garbage (a mixture of glue, varnish, sandpaper, and wood scraps). The first row of Table 12.6 shows the total amount of garbage (in tons) that each film currently produces. The other rows of the table show the cost of reducing garbage produced by the first five tons, the second five tons, and so on. First, calculate the cost of requiring each firm to reduce the weight of its garbage by one-fourth. Now, imagine that the government issues marketable permits for the current level of garbage, but the permits will shrink the weight of allowable garbage for each film by one-fourth. What will be the result of this alternative approach to reducing pollution?

Trending nowThis is a popular solution!

Chapter 12 Solutions
PRINCIPLES OF MICROECONOMICS (OER)
Additional Business Textbook Solutions
Horngren's Cost Accounting: A Managerial Emphasis (16th Edition)
Cost Accounting (15th Edition)
Construction Accounting And Financial Management (4th Edition)
Principles of Accounting Volume 2
Financial Accounting (12th Edition) (What's New in Accounting)
Horngren's Accounting (11th Edition)

- 30 8 01:12:27 Mc Graw Hill Use the following supply and demand graph to answer the question below. Price 0 ABC D₂ Multiple Choice Quantity S₁ and D₁ represent the current market supply and demand, respectively. S2 and D2 represent the socially optimal supply and demand. One way that the government could shift demand to its socially optimal level is to tax the sellers subsidize the buyers. tax the buyersarrow_forwardDefine pollution charge and will our economy be able to control pollution? Share your thoughts in a paragraph.arrow_forwardUse a graph to illustrate the quantity of pollution that would be emitted (a) after a corrective tax has been imposed and (b) after tradable pollution permits have been imposed. Could these two quantities ever be equivalent?arrow_forward
- price 100 90 MPC-MSC 80 70 30,67.5 60 40,60) 50 30,45) 40 40,37.5) MSB 30 20 10 MPB 10 20 30 40 50 60 70 80 90 100 quantity of trees (thousands) Trees planted in urban areas improve air quality, reduce soil erosion, and moderate temperatures in hot cities. The figure depicts the market for trees planted in Tempe, Arizona. What is the value of the deadweight loss if the market is unregulated? To review this concept, see the section Positive Externalities. 100 50 225 112.5arrow_forwardPRICE OF WILDFLOWERS 9. Efficiency in the presence of externalities Wildflowers grant many external benefits on society: the benefits they bestow on pollinators and other native species, improving local ecosystems, and so on. Therefore, the market equilibrium quantity of wildflowers does not equal the socially optimal quantity. The following graph plots the demand for wildflowers (their private value), the supply of wildflowers (the private cost of producing them), and the social value of wildflowers, including both the private value and external benefits. Use the black point (plus symbol) to indicate the market equilibrium quantity. Next, use the purple point (diamond symbol) to indicate the socialy optimal quantity. Supply Market Equilibrium (Private Cost Social Value Demand (Private Value) QUANTITY OF WILDFLOWERS Socially Optimal Levelarrow_forwardWhat is an environmental pollutionarrow_forward
- Which of the following is an example of an externality? (x) cigarette smoke that permeates an entire restaurant (y) a flu shot that prevents a student from transmitting the virus to her roommate (z) a beautiful flower garden outside of the local post office Select one or more: a. (x), (y) and (z) b. (x) and (y) only c. (x) and (z) only d. (y) and (z) only e. (y) onlyarrow_forwardThe graph shows the marginal benefit and marginal cost of a waste disposal system in a city of 1 million people. What is the efficient capacity of the waste disposal system and how much does each citizen pay in taxes? The efficient capacity is ... million gallons a day. If the city installs the efficient capacity, each person pays ... in taxes.arrow_forwardWhat is air pollutionarrow_forward
- Chapter 8 in Tietenberg and Lewis looks at climate change, the most important environmental issue of our time. Economists generally agree that putting a price on carbon is the best approach to reducing climate warming carbon emissions. The two main strategies for doing this are carbon taxes and the cap and trade version of emissions trading. Discuss the pros and cons to these two approaches to pricing carbon. Why do economists favor these kinds of market-based strategies to pollution control over “command and control” approaches such technology standards?arrow_forwardA local school administrator observes an increase in the number of flu cases in the public schools over the last two years. She is concerned that some families cannot afford flu vaccine and are therefore not having children vaccinated. She is also concerned that the failure to vaccinate some children is putting other children at risk, so she proposes that the state subsidize vaccines to increase coverage rates. a. Determine whether the failure to vaccinate some children is an external benefit or an external cost. If an external cost is present, move point A and point B to show the marginal social cost curve. If an external benefit is present, move point A and point B to show the marginal social benefit curve. Place point C at the equilibrium outcome. Place point D at the socially optimal outcome. Flu vaccines A B D Supply (marginal private cost) Pricearrow_forwardFigure 5-4Suppose there are several paper mills producing paper for a market. These mills, located upstream from a fishing village, discharge a large amount of wastewater into the river. The waste material affects the number of fish in the river and the use of the river for recreation and as a public water supply source. Figure 5-4 shows the paper market. Use this Figure to answer the following question(s).Refer to Figure 5-4. What does S1 represent? Question 4 options: A) the market supply curve that reflects social cost B) the market supply curve that reflects only external cost C) the market supply curve that reflects only private benefit D) the market supply curve that reflects private costarrow_forward


 Economics (MindTap Course List)EconomicsISBN:9781337617383Author:Roger A. ArnoldPublisher:Cengage Learning
 Microeconomics: Principles & PolicyEconomicsISBN:9781337794992Author:William J. Baumol, Alan S. Blinder, John L. SolowPublisher:Cengage Learning