
Fundamentals of Biostatistics
8th Edition
ISBN: 9781305268920
Author: Bernard Rosner
Publisher: Cengage Learning
expand_more
expand_more
format_list_bulleted
Videos
Textbook Question
Chapter 12, Problem 6P
Pulmonary Disease
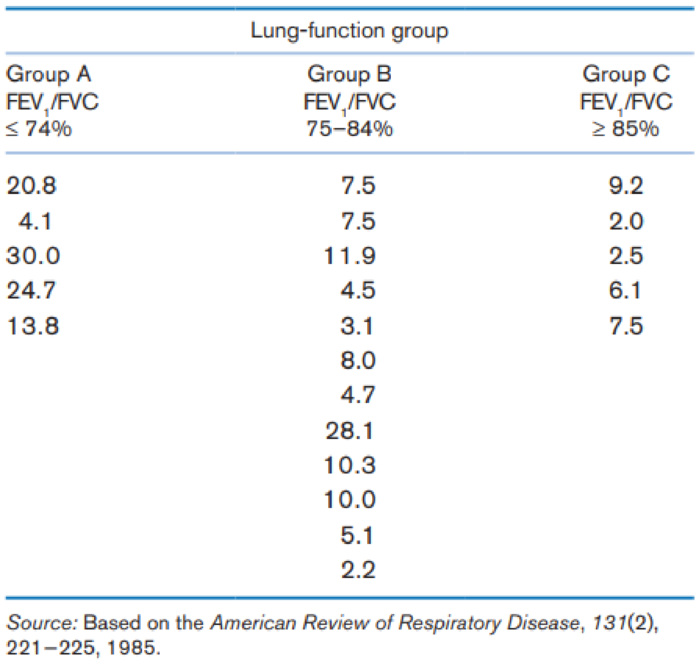
Twenty-two young asthmatic volunteers were studied to assess the short-term effects of sulfur dioxide (SO2) exposure under various conditions [12]. The baseline data in Table 12.30 were presented regarding bronchial reactivity to SO2 stratified by lung
Test the hypothesis that there is an overall mean difference in bronchial reactivity among the three lung-function groups.
Table 12.30 Relationship of bronchial reactivity to SO2 (cm H2O/s) grouped by lung function at screening among 22 asthmatic volunteers
Expert Solution & Answer

Trending nowThis is a popular solution!

Students have asked these similar questions
Reduced heart rate variability (HRV) is known to be a predictor of mortality after a heart attack. One measure of HRV is the average of normal-to-normal beat interval (in milliseconds) for a 24-hour time period. Twenty-two heart attack patients who were dog owners and 80 heart attack patients who did not own a dog participated in a study of the effect of pet ownership on HRV, resulting in the summary statistics shown in the accompanying table.
Measure ofHRV (averagenormal-to-normalbeat interval)
Mean
StandardDeviation
Owns Dog
874
136
Does Not Own Dog
801
133
(a) The authors of this paper used a two-sample t test to test H0: ?1 - ?2 = 0 versus Ha: ?1 - ?2 ≠ 0. What assumptions must be reasonable in order for this to be an appropriate method of analysis?We must assume that the population distributions ---Select--- are aren't approximately normal.(b) The paper indicates that the null hypothesis from Part (a) was rejected and reports that the P-value is less than…
Anemia (low healthy blood cells or hemoglobin) has an important role in exercise performance.
However, the direct link between rapid changes of hemoglobin and exercise performance is
still unknown. A study investigated 18 patients with a blood disorder (beta-thalassemia).
Participants in the study performed an exercise test before and the day after receiving a blood
transfusion. Data are given in the table.
HB = Hemoglobin
RER = Respiratory exchange
ID
Change in
HB
Obese
RER > 1.1
ratio
No
No
1
-1.4
No
-1.5
No
Yes
No
Yes
3
-2
No
4
-2.1
No
-1.9
Yes
Yes
No
-1.6
-1.8
-0.8
6
7
No
Yes
No
Yes
8
9.
-1
No
No
-1.2
No
Yes
10
11
No
No
-0.8
-1.5
12
Yes
No
No
Yes
13
14
-1.4
-2.6
-1.7
No
No
Yes
Yes
15
Yes
No
Yes
Yes
16
-2.6
No
17
18
-2.7
-1.5
No
Reduced heart rate variability (HRV) is known to be a predictor of mortality after a heart attack. One measure of HRV is the average normal-to-normal beat interval (in milliseconds) for a 24-hr time period. Twenty-two heart attack patients who were dog owners and 80 heart attack patients who did not own a dog participated in a study of the effect of pet ownership on HRV, resulting in the summary statistics shown in the accompanying table.
The authors of this paper used a two-sample t test to test H0: ?1 − ?2 = 0 versus Ha: ?1 − ?2 ≠ 0.
What conditions must be met in order for this to be an appropriate method of analysis? (Select all that apply.)
Find the test statistic and P-value.
Chapter 12 Solutions
Fundamentals of Biostatistics
Ch. 12 - Nutrition Researchers compared protein intake...Ch. 12 - Nutrition Researchers compared protein intake...Ch. 12 - Prob. 3PCh. 12 - Prob. 4PCh. 12 - Prob. 5PCh. 12 - Pulmonary Disease Twenty-two young asthmatic...Ch. 12 - Pulmonary Disease Twenty-two young asthmatic...Ch. 12 - Prob. 8PCh. 12 - Prob. 32PCh. 12 - Gastroenterology In Table 12.39, we present data...
Knowledge Booster


Learn more about
Need a deep-dive on the concept behind this application? Look no further. Learn more about this topic, statistics and related others by exploring similar questions and additional content below.Similar questions
- Reduced heart rate variability (HRV) is known to be a predictor of mortality after a heart attack. One measure of HRV is the average normal-to-normal beat interval (in milliseconds) for a 24-hr time period. Twenty-two heart attack patients who were dog owners and 80 heart attack patients who did not own a dog participated in a study of the effect of pet ownership on HRV, resulting in the summary statistics shown in the accompanying table.arrow_forwardReduced heart rate variability (HRV) is known to be a predictor of mortality after a heart attack. One measure of HRV is the average normal-to-normal beat interval (in milliseconds) for a 24-hr time period. Twenty-two heart attack patients who were dog owners and 80 heart attack patients who did not own a dog participated in a study of the effect of pet ownership on HRV, resulting in the summary statistics shown in the accompanying table. Measure of HRV(Average Normal-to-Normal Beat Interval) Mean StandardDeviation Owns Dog 871 134 Does Not Own Dog 800 138 (b) The paper indicates that the null hypothesis in part (a) was rejected and reported that the P-value was less than 0.05. Carry out a two-sample t test. (Use ? = 0.05. Use ?1 for heart attack patients who are dog owners and ?2 for heart attack patients who do not own a dog.) Find the test statistic and P-value. (Use SALT. Round your test statistic to one decimal place and your P-value to three decimal places.) t=…arrow_forward
Recommended textbooks for you
 Glencoe Algebra 1, Student Edition, 9780079039897...AlgebraISBN:9780079039897Author:CarterPublisher:McGraw Hill
Glencoe Algebra 1, Student Edition, 9780079039897...
Algebra
ISBN:9780079039897
Author:Carter
Publisher:McGraw Hill
Hypothesis Testing using Confidence Interval Approach; Author: BUM2413 Applied Statistics UMP;https://www.youtube.com/watch?v=Hq1l3e9pLyY;License: Standard YouTube License, CC-BY
Hypothesis Testing - Difference of Two Means - Student's -Distribution & Normal Distribution; Author: The Organic Chemistry Tutor;https://www.youtube.com/watch?v=UcZwyzwWU7o;License: Standard Youtube License