
Concept explainers
Videos
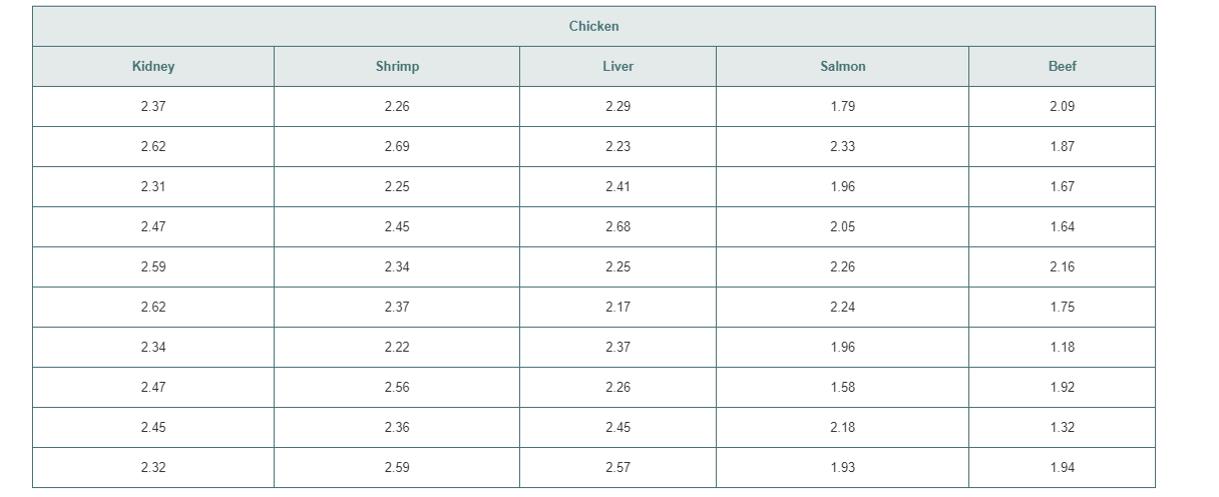
A pet food company has the business objective of expending its product line beyond its current kidney and shrimp-based cat food. The company developed two new products-one based on chicken livers and the other based on salmon. The conducted an experiment to compare the two new products with its two existing ones, as well as a generic beef-bases product sold at a supermarket chain.
For the experiment, a sample of 50 cats from the population at a local animal shelter was selected. Ten Cats were randomly assigned to each of the five products being tested. Each of the cats was then presented with 3 ounces of the selected food in a dish at feeding time. The researchers defined the variable to be measured as the number of ounces of food that the cat consumed with a 10-minutes time interval that began when the filled dish was presented. The results for this experiment are summarized in the table in the next column and stored in CatFood.
a. At the 0.05 level of significance, is there evidence is there evidence of significant difference in the median amount of food eaten among the various products?
b. Compare the result of (a) with those of problem 11.13 (a) on page 413.
c. Which test is more appropriate for these data: the Kruskal-Wallis rank test of the one-way ANOVA F test? Explain.
Want to see the full answer?
Check out a sample textbook solution
Chapter 12 Solutions
Basic Business Statistics, Student Value Edition


- List the sample space of each experiment. Picking a one-digit numberarrow_forwardA school psychologist wants to test the effectiveness of a new method of teaching biologybiology. She recruits 500500 firstfirst-grade students and randomly divides them into two groups. Group 1 is taught by means of the new method, while group 2 is taught by traditional methods. The same teacher is assigned to teach both groups. At the end of the year, an achievement test (graded on a scale from 1-10) is administered and the results of the two groups are compared. Complete parts (a) through (i) below.(a) What is the response variable in this experiment? A.The scores on the achievement tests of both group 1 and group 2 B.The students' ability in biologybiology C.The score of group 1 on the achievement test D.The score of group 2 on the achievement test (b) Is the response variable qualitative or quantitative? A.The response variable is quantitative because it is a measurement. B.The response variable is quantitative because it is a characteristic. C.The response variable is…arrow_forwardThe Best Pet Food company has a business objective of expanding its product line beyond its current Beef and Salmon cat food. The company developed two new products, one based on Chicken Liver and the other based on Shrimp. The company conducted an experiment to compare the two new products with its two existing ones, as well as a generic Kidney-based product sold in a supermarket chain. For the experiment, a sample of 40 cats was selected at the Toronto Cat Rescue Volunteer Centre. A random selection of eight cats were assigned to each of the five products being tested. Each of the cats was then presented with 5 ounces of the selected food in a dish at feeding time. The researchers defined the variable to be measured as the number of ounces of food that the cat consumed within a 10-minute interval that began when the filled dish was presented. The results of this experiment are given below. Beef 4.79 4.10 4.98 4.18 4.32 Salmon 4.86 4.90 4.76 4.86 4.86 4.69 4.46 4.88 SUMMARY Groups…arrow_forward
- During the 2004 senatorial campaign in a large southwestern state, illegal immigration was a major issue. One of the candidates argued that illegal immigrants made use of educational and social services without having to pay property taxes. The other candidate pointed out that the cost of new homes in their state was 20–30% less than the national average due to the low wages received by the large number of illegal immigrants working on new home construction. A random sample of 5,500 registered voters was asked the question, “Are illegal immigrants generally a benefit or a liability to the state’s economy?” The results were as follows: 3,500 people responded “liability,” 1,500 people responded “benefit,” and 500 people responded “uncertain.” a. What is the population of interest? b. What is the population from which the sample was selected? c. Does the sample adequately represent the population? d. If a second random sample of 5,000 registered voters was selected, would the results be…arrow_forwardA company wishes to evaluate the effect of package design on one of its products, a certain brand of cereal. The four package designs are to be tested in different stores throughout a large city. There are 20 stores available for the study. The amount of cereal sold is known to vary depending on the size of the stores. The 20 stores are divided into five groups of four stores each by size. The following sales figures ($1000s) were obtained after a 1-month period. Stores Design A Design B Design C Design D 1 40 33 37 38 2 45 27 32 40 3 43 31 30 41 4 44 38 40 42 5 56 45 49 42 Enter the above data into a suitable software and then conduct an analysis of variance without blocking to test whether there is evidence of a significant difference in mean sales of different package designs. Use alpha = 0.01. the p-value associated with the observed test statistic? Please provide your answer to the nearest fou decimal places.arrow_forwardA pharmaceutical company is testing the effectiveness of its vaccine across two different age brackets. They take a sample and split the participants up into two separate groups. Group A consists of 44 people who are between ages 13 and 18. Group B consists of 58 people between ages 19 and 26. After being administered the vaccine, it was found that 37 people from group A were immune to the virus and 42 people from group B were immune. What proportion of people from Group A were immune? What proportion of people from Group B were immune? What proportion of people in this study were immune?arrow_forward
- A company wishes to evaluate the effect of package design on one of its products, a certain brand of cereal. The four package designs are to be tested in different stores throughout a large city. There are 20 stores available for the study. The amount of cereal sold is known to vary depending on the size of the stores. The 20 stores are divided into five groups of four stores each by size. The following sales figures ($1000s) were obtained after a 1-month period. Stores Design A Design B Design C Design D 1 40 33 37 38 2 45 27 32 40 3 43 31 30 41 4 44 38 40 42 5 56 45 49 42 Enter the above data into a suitable software and then conduct an analysis of variance with blocking (analyze this data as a complete block design) to test further whether there is evidence of a significant difference in mean sales of different package designs. Use alpha = 0.01. What are the mean squares for Treatments? Provide your answer to the nearest 2 decimal places.arrow_forwardA company wishes to evaluate the effect of package design on one of its products, a certain brand of cereal. The four package designs are to be tested in different stores throughout a large city. There are 20 stores available for the study. The amount of cereal sold is known to vary depending on the size of the stores. The 20 stores are divided into five groups of four stores each by size. The following sales figures ($1000s) were obtained after a 1-month period. Stores Design A Design B Design C Design D 1 40 33 37 38 2 45 27 32 40 3 43 31 30 41 4 44 38 40 42 5 56 45 49 42 Enter the above data into a suitable software and then conduct an analysis of variance with blocking (analyze this data as a complete block design) to test further whether there is evidence of a significant difference in mean sales of different package designs. Use alpha=0.01. What are the sums of squares for Blocks? Provide your answer to the nearest 2 decimal places.arrow_forwardA company wishes to evaluate the effect of package design on one of its products, a certain brand of cereal. The four package designs are to be tested in different stores throughout a large city. There are 20 stores available for the study. The amount of cereal sold is known to vary depending on the size of the stores. The 20 stores are divided into five groups of four stores each by size. The following sales figures ($1000s) were obtained after a 1-month period. Stores Design A Design B Design C Design D 1 40 33 37 38 2 45 27 32 40 3 43 31 30 41 4 44 38 40 42 5 56 45 49 42 Enter the above data into a suitable software and then conduct an analysis of variance without blocking to test whether there is evidence of a significant difference in mean sales of different package designs. Use alpha=0.01. What is the conclusion for the null hypothesis that all treatment means are equal? O Do not reject HO. There is sufficient evidence to conclude that the average sales for all stores are not…arrow_forward
 Glencoe Algebra 1, Student Edition, 9780079039897...AlgebraISBN:9780079039897Author:CarterPublisher:McGraw Hill
 Holt Mcdougal Larson Pre-algebra: Student Edition...AlgebraISBN:9780547587776Author:HOLT MCDOUGALPublisher:HOLT MCDOUGAL
 College Algebra (MindTap Course List)AlgebraISBN:9781305652231Author:R. David Gustafson, Jeff HughesPublisher:Cengage Learning