Concept explainers
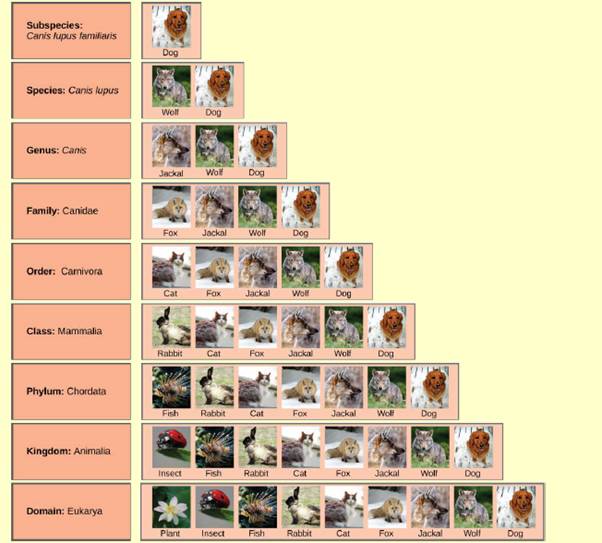
Figure 12.3 In what levels are cats and dogs considered to be part of the same group?


To determine:
The levels in which the cats and dogs are considered to be the part of same group.
Introduction:
The hierarchical system classifies the various species into the groups. Such system is also termed as the taxonomic classification, as each level as termed taxa here. Broadly the organism is classified in kingdom and domain. The genus and the species name are the most accurate classification.
Explanation of Solution
The scientific name of the cat is Felis catus which belongs to the family Felidae. They are domestic cats. The classification of the cat is as below:
Kingdom − Animalia (It is composed of multicellular eukaryotic animals.)
Phylum − Chordata (The organisms that contain notochord, dorsal nerve cord, pharyngeal slits, an endostyle, and a post-anal tail during any period of their life cycle.)
Class − Mammalia (The vertebrate animals compose this class.)
Order − Carnivora (It is composed of meat-eating animals.)
Suborder − Feliformia (It contains the cat-like carnivores.)
Family − Felidae (This family mainly consists of cats only.)
Subfamily − Felinae (This subfamily is comprised of small cats. These cats do not roar but are able to purr.)
The scientific name of the dog is Canis lupus familiaris. It is basically the domestic dog. The scientific classification of the dog is as follow:
Kingdom − Animalia
Phylum − Chordata
Class − Mammalia
Order − Carnivora
Family − Canidae (This family consists of domestic dogs, wolves, coyotes, foxes, jackals, and others.)
The cats and the dogs belong to the kingdom Animalia, phylum Chordata, class Mammalia, and order Carnivora. This means that both dogs and cats are multicellular animals, that contained notochord and other differential structures during their lifetime. Moreover, they are vertebrate and are carnivorous animals.
The cats and the dogs are similar at the levels of kingdom, phylum, class, and order.
Want to see more full solutions like this?
Chapter 12 Solutions
Concepts of Biology
Additional Science Textbook Solutions
Biology: Life on Earth (11th Edition)
Genetic Analysis: An Integrated Approach (3rd Edition)
Microbiology: An Introduction
Applications and Investigations in Earth Science (9th Edition)
Biological Science (6th Edition)
Concepts of Genetics (12th Edition)
- Fitness 6. The primary theory to explain the evolution of cooperation among relatives is Kin Selection. The graph below shows how Kin Selection theory can be used to explain cooperative displays in male wild turkeys. B When paired, subordinant males increase the reproductive success of their solo, dominant brothers. 0.9 C 0 Dominant Solo EVOLUTION Se, Box 13.2 © 2023 Oxford University Press rB rB-C Direct Indirect Fitness fitness fitness gain Subordinate 19 Fitness After A. H. Krakauer. 2005. Nature 434: 69-72 r = 0.42 Subordinant Dominant a) Use Hamilton's Rule to show how Kin Selection can support the evolution of cooperation in this system. Show the math. (4 b) Assume that the average relatedness among male turkeys in displaying pairs was instead r = 0.10. Could kin selection still explain the cooperative display behavior (show math)? In this case, what alternative explanation could you give for the behavior? (4 pts) 7. In vampire bats (pictured below), group members that have fed…arrow_forwardExamine the following mechanism and classify the role of each labeled species in the table below. Check all the boxes that applyarrow_forward1. Define and explain the two primary evolutionary consequences of interspecific competitionarrow_forward
- 2 A linear fragment of DNA containing the Insulin receptor gene is shown below, where boxes represent exons and lines represent introns. Assume transcription initiates at the leftmost EcoRI site. Sizes in kb are indicated below each segment. Vertical arrows indicate restriction enzyme recognition sites for Xbal and EcoRI in the Insulin receptor gene. Horizontal arrows indicate positions of forward and reverse PCR primers. The Horizontal line indicates sequences in probe A. Probe A EcoRI Xbal t + XbaI + 0.5kb | 0.5 kb | 0.5 kb | 0.5kb | 0.5 kb | 0.5 kb | 1.0 kb EcoRI On the gel below, indicate the patterns of bands expected for each DNA sample Lane 1: EcoRI digest of the insulin receptor gene Lane 2: EcoRI + Xbal digest of the insulin receptor gene Lane 3: Southern blot of the EcoRI + Xbal digest insulin receptor gene probed with probe A Lane 4: PCR of the insulin receptor cDNA using the primers indicated Markers 6 5 4 1 0.5 1 2 3 4arrow_forward4. (10 points) woman. If both disease traits are X-linked recessive what is the probability A man hemizygous for both hemophilia A and color blindness mates with a normal hemophilia A nor colorblindness if the two disease genes show complete that a mating between their children will produce a grandson with neither a. linkage? (5 points) that a mating between their children will produce a grandson with both hemophilia A and colorblindness if the two disease genes map 40 cM apart? (5 points)arrow_forward2 2 1.5 1.0 0.67 5. (15 points) An individual comes into your clinic with a phenotype that resembles Down's syndrome. You perform CGH by labeling the patient's hobe DNA red and her mother's DNA green. Plot the expected results of the Red:Green ratio if: A. The cause of the syndrome was an inversion on one chromosome 21 in the child 0.5 1.5 1.0 0.67 0.5 21 p 12345678910 CEN q 123456789 10 11 12 13 14 15 16 17 18 19 B. The cause of the syndrome was a duplication of the material between 21q14 and 21q18 on one chromosome in the child 21 p 123456789 10 CEN q 12345678910 11 12 13 14 15 16 17 18 19 C. The mother carried a balanced translocation that segregated by adjacent segregation in meiosis I and resulted in a duplication in the child of the material distal to the translocation breakpoint at 21q14. 1.5 1.0 0.67 0.5 21 p 12345678910 CEN q 123456789 10 11 12 13 14 15 16 17 18 19 mom seal bloarrow_forward
- 4. You find that all four flower color genes map to the second chromosome, and perform complementation tests with deletions for each gene. You obtain the following results: (mutant a = blue, mutant b = white, mutant c = pink, mutant d = red) wolod Results of Complementation tests suld Jostum Mutant a b с Del (2.2 -2.6) blue white pink purple Del (2.3-2.8) blue white pink red Del (2.1 -2.5) blue purple pink purple Del (2.4-2.7) purple white pink red C d Indicate where each gene maps: a b ori ai indW (anioq 2) .8arrow_forwardlon 1. Below is a pedigree of a rare trait that is associated with a variable number repeat. PCR was performed on individuals using primers flanking the VNR, and results are shown on the agarose gel below the pedigree. I.1 1.2 II.1 II.2 II.3 II.4 II.5 II.6 11.7 III.1 III.2 III.3 III.4etum A. (5 points) What is the mode of inheritance? B. (10 points) Fill in the expected gel lanes for II.1, II.5, III.2, III.3 and III.4 C. (5 points) How might you explain the gel results for II.4?arrow_forwardTo study genes that create the purple flower color in peas, you isolate 4 amorphic mutations. Each results in a flower with a different color, described mutant a = blue mutant c = pink mutant b = white mutant d = red A. In tests of double mutants, you observe the following phenotypes: mutants a and b = blue mutants b and c = white mutants c and d = pink Assuming you are looking at a biosynthetic pathway, draw the pathway indicating which step is affected by each mutant. B. What is the expected flower color of a double mutant of a and c?arrow_forward
 Concepts of BiologyBiologyISBN:9781938168116Author:Samantha Fowler, Rebecca Roush, James WisePublisher:OpenStax College
 Biology 2eBiologyISBN:9781947172517Author:Matthew Douglas, Jung Choi, Mary Ann ClarkPublisher:OpenStax


