
Financial Accounting, Student Value Edition Plus MyLab Accounting with Pearson eText -- Access Card Package (12th Edition)
12th Edition
ISBN: 9780134833156
Author: C. William Thomas, Wendy M. Tietz, Walter T. Harrison Jr.
Publisher: PEARSON
expand_more
expand_more
format_list_bulleted
Videos
Textbook Question
Chapter 12, Problem 12.65BP
LO 4
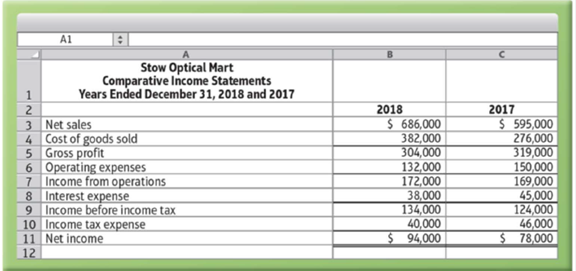
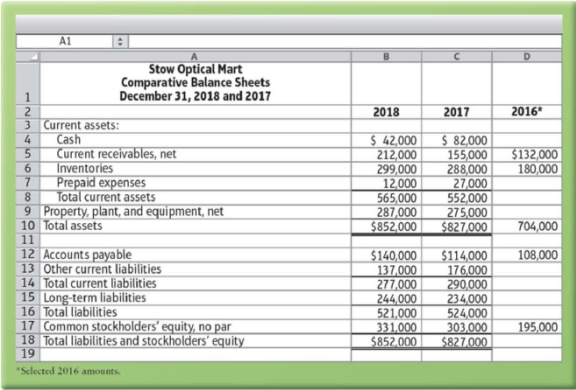
(Learning Objective 4: Use ratios to evaluate a stock investment) Comparative financial statement data of Stow Optical Mart follow:
Other information:
- 1. Market price of Stow Optical Mart common stock: $122.91 at December 31 , 2018, and $165.75 at December 31, 2017
- 2. Common shares outstanding: 13,000 during 2018 and 8,000 during 2017
- 3. All sales on credit
- 4. Cash dividends paid per share: $2.75 per share in 2018 and $4.00 in 2017
Requirements
1. Calculate the following ratios for 2018 and 2017:
- a.
Current ratio - b. Quick (acid-test) ratio
- c. Receivables turnover and days’ sales outstanding (DSO)-round to the nearest whole day
- d. Inventory turnover and days’ inventory outstanding (DIO)-round to the nearest whole day
- e. Accounts payable turnover and days’ payable outstanding (DPO)-use cost of goods sold in the turnover ratio and round DPO to the nearest whole day
- f. Cash conversion cycle (in days)
- g. Times-interest-earned ratio
- h. Return on assets-use DuPont Analysis
- i. Return on common stockholders’ equity-use DuPont Analysis
- j. Earnings per share of common stock
- k. Price-earnings ratio
2. Decide whether (a) Stow Optical Mart’s financial position improved or deteriorated during 2018 and (b) whether the investment attractiveness of the company’s common stock appears to have increased or decreased from 2017 to 2018.
3. How will what you learned in this problem help you evaluate an investment?
Expert Solution & Answer
Want to see the full answer?
Check out a sample textbook solution
Students have asked these similar questions
Additional information:
1.
The market price of Pina’s common stock was $7.00, $7.50, and $8.50 for 2020, 2021, and 2022, respectively.
2.
You must compute dividends paid. All dividends were paid in cash.
Compute the following ratios for 2021 and 2022.
2022
2021
Profit margin
enter percentages
%
enter percentages
%
(Round answers to 1 decimal place, e.g. 1.5%.)
Gross profit rate
enter percentages
%
enter percentages
%
(Round answers to 1 decimal place, e.g. 1.5%.)
Asset turnover
enter asset turnover in times
times
enter asset turnover in times
times
(Round answers to 2 decimal places, e.g. 1.83.)
Earnings per share
$enter earnings per share in dollars
$enter earnings per share in dollars
(Round answers to 2 decimal places, e.g. 1.83.)
Price-earnings ratio
enter price-earnings ratio in times
times
enter price-earnings ratio in times
times
(Round answers to 1 decimal place,…
Profitability Ratios
The following selected data were taken from the financial statements of Vidahill Inc. for December 31, 2017, 20Y6, and 20Y5:
December 31
20Y7
20Y6
20Y5
Total assets
$163,000
$147,000
$131,000
Notes payable (8% interest)
50,000
50,000
50,000
Common stock
20,000
20,000
20,000
Preferred 5% stock, $100 par
10,000
10,000
10,000
(no change during year)
Retained earnings
59,090
39,790
30,000
The 2017 net income was $19,800, and the 2016 net income was $10,290. No dividends on common stock were declared between 2015 and 20Y7. Preferred dividends were declared and paid in full in 2016 and 2017.
a. Determine the return on total assets, the rate earned on stockholders' equity, and the return on common stockholders' equity for the years 2016 and 2017. When required, round to one decimal place.
20Y7
20Y6
Return on total assets
Return on stockholders' equity
Return on common stockholders' equity
%
%
%
%
%
%
b. The profitability ratios indicate that Vidahill Inc.'s profitability…
Profitability ratios
The following selected data were taken from the financial statements of Vidahill Inc. for December 31, 2017, 20Y6, and 20Y5:
December 31
20Y7
December 31
20Y6
December 31
20Y5
Total assets
$307,000
$277,000
$247,000
Notes payable (8% interest)
100,000
100,000
100,000
Common stock
40,000
40,000
40,000
Preferred 6% stock, $100 par
(no change during year)
Retained earnings
20,000
109,920
20,000
80,240
20,000
60,000
The 20Y7 net income was $30,880, and the 2016 net income was $21,440. No dividends on common stock were declared between 2015 and 2017. Preferred dividends were declared and paid in full in 2016 and 2017.
a. Determine the return on total assets, the return on stockholders' equity, and the return on common stockholders' equity for the years 2016 and 2017. When required, round your answers to one decimal place.
20Y7
20Y6
Return on total assets
Return on stockholders' equity
Return on common stockholders' equity
%
%
%
%
%
%
b. The profitability ratios indicate…
Chapter 12 Solutions
Financial Accounting, Student Value Edition Plus MyLab Accounting with Pearson eText -- Access Card Package (12th Edition)
Ch. 12 - Prob. 1QCCh. 12 - Prob. 2QCCh. 12 - Prob. 3QCCh. 12 - Prob. 4QCCh. 12 - Expressing accounts receivable as a percentage of...Ch. 12 - Kincaid Company reported the following data (in...Ch. 12 - Prob. 7QCCh. 12 - Ratios that measure liquidity include all of the...Ch. 12 - Verba Corporation has an inventory turnover of 15...Ch. 12 - The measure of a companys ability to collect cash...
Ch. 12 - A ratio that measures a companys profitability is...Ch. 12 - Prob. 12QCCh. 12 - Prob. 13QCCh. 12 - Prob. 14QCCh. 12 - Prob. 12.1ECCh. 12 - Prob. 12.1SCh. 12 - Prob. 12.2SCh. 12 - Prob. 12.3SCh. 12 - Prob. 12.4SCh. 12 - Prob. 12.5SCh. 12 - (Learning Objective 4: Evaluate a companys quick...Ch. 12 - Prob. 12.7SCh. 12 - (Learning Objective 4: Measure ability to pay...Ch. 12 - (Learning Objective 4: Measure profitability using...Ch. 12 - Prob. 12.10SCh. 12 - (Learning Objective 4: Use ratio data to...Ch. 12 - Prob. 12.12SCh. 12 - (Learning Objective 4: Analyze a company based on...Ch. 12 - Prob. 12.14SCh. 12 - Prob. 12.15SCh. 12 - Prob. 12.16AECh. 12 - Prob. 12.17AECh. 12 - Prob. 12.18AECh. 12 - Prob. 12.19AECh. 12 - Prob. 12.20AECh. 12 - Prob. 12.21AECh. 12 - Prob. 12.22AECh. 12 - Prob. 12.23AECh. 12 - Prob. 12.24AECh. 12 - Prob. 12.25AECh. 12 - Prob. 12.26AECh. 12 - Prob. 12.27BECh. 12 - Prob. 12.28BECh. 12 - Prob. 12.29BECh. 12 - Prob. 12.30BECh. 12 - Prob. 12.31BECh. 12 - LO 4 (Learning Objective 4: Calculate ratios;...Ch. 12 - Prob. 12.33BECh. 12 - Prob. 12.34BECh. 12 - Prob. 12.35BECh. 12 - Prob. 12.36BECh. 12 - Prob. 12.37BECh. 12 - Prob. 12.38QCh. 12 - Prob. 12.39QCh. 12 - Prob. 12.40QCh. 12 - Prob. 12.41QCh. 12 - Prob. 12.42QCh. 12 - Prob. 12.43QCh. 12 - Prob. 12.44QCh. 12 - Use the Orlando Medical Corporation financial...Ch. 12 - Prob. 12.46QCh. 12 - Use the Orlando Medical Corporation financial...Ch. 12 - Prob. 12.48QCh. 12 - Prob. 12.49QCh. 12 - Prob. 12.50QCh. 12 - Prob. 12.51QCh. 12 - Prob. 12.52QCh. 12 - Prob. 12.53QCh. 12 - Prob. 12.54QCh. 12 - Prob. 12.55QCh. 12 - LO 1, 2, 4 (Learning Objectives 1, 2, 4: Calculate...Ch. 12 - Prob. 12.57APCh. 12 - Prob. 12.58APCh. 12 - LO 4 (Learning Objective 4: Use ratios to evaluate...Ch. 12 - Prob. 12.60APCh. 12 - LO 2, 4, 5 (Learning Objectives 2, 4, 5: Analyze...Ch. 12 - Group B LO 1, 2, 4 (Learning Objectives 1, 2, 4:...Ch. 12 - Prob. 12.63BPCh. 12 - Prob. 12.64BPCh. 12 - LO 4 (Learning Objective 4: Use ratios to evaluate...Ch. 12 - Prob. 12.66BPCh. 12 - LO 2, 4, 5 (Learning Objectives 2, 4, 5: Analyze...Ch. 12 - Prob. 12.68CEPCh. 12 - Prob. 12.69CEPCh. 12 - (Learning Objectives 2, 3.4: Use trend...Ch. 12 - (Learning Objectives 4, 5: Calculate and analyze...Ch. 12 - Prob. 12.72DCCh. 12 - Prob. 12.73DCCh. 12 - Prob. 12.74EICCh. 12 - Focus on Financials Apple Inc. LO 1, 2, 3, 4, 5...Ch. 12 - Comprehensive Financial Statement Analysis Project...
Knowledge Booster


Learn more about
Need a deep-dive on the concept behind this application? Look no further. Learn more about this topic, accounting and related others by exploring similar questions and additional content below.Similar questions
- Basic earning per share ratio= (net income- prefered dividends)/weighted average common shares outstanding (21,331-0)/500= $42.66 (2020 year) (11,588-0)/494= $23.46 (2019 year) $5.19 (Walmart 2020 year) (competitor) Write financial analysis report.arrow_forwardProblem #8. Profitability Ratios Gonzales is analyzing the earnings performance of the Bobadilla Transport Corporation. He has gathered the following data from Bobadilla's financial statements and from a report of the closing market prices of shares: Profit for 2019 Preference dividends declared during 2019 Ordinary dividends declared Dec. 31, 2019 Number of Bobadilla ordinary shares outstanding: P743,000 60,000 620,000 Jan. 1, 2019 Dec. 31, 2019 1,100,000 shs. 1,300,000 shs. Market price per ordinary share on Dec. 31, 2019 P15 Calculate the following ratios relating to the Bobadilla share: 1. Basic earnings per ordinary share 2. Price-earnings ratio 3. Dividend yield on ordinary sharearrow_forwardYou are given the following information: Stockholders? equity = GHS1,250; price/earnings ratio = 5; shares outstanding = 25; and %3D market/book ratio = 1.5. %3D Calculate the market price of a share of the company?s stock. O A. GHS 33.33 B. GHS 75.00 C. GHS 10.00 D. GHS166.67 O E. GHS133.32arrow_forward
- Complete this section of the income statement in the table below. attached is the income statement and balance sheet for your reference. Per Share Data 2021 Common Stock Price $ 28.0 Earnings Per Share (EPS) Dividend Per Share (DPS) Book Value Per Share (BVPS) Cash Flow Per Sharearrow_forwardUse the common-size financial statements found here: ommon-Size Balance Sheet 2016Cash and marketable securities $ 480 1.5 %Accounts receivable 6,030 18.2Inventory 9,540 28.8Total current assets $ 16,050 48.5 %Net property, plant, and equipment 17,020 51.5Total assets $33,070 100.0 %Accounts payable $ 7,150 21.6 %Short-term notes 6,850 20.7Total current liabilities $ 14,000 42.3 %Long-term liabilities 7,010 21.2Total liabilities $ 21,010 63.5 %Total common shareholders’ equity 12,060 36.5Total liabilities and shareholders’ equity $33,070 100.0 %Common-Size Income Statement 2016Revenues $ 30,000 100.0 %Cost of goods sold (20,050) 66.8Gross profit $ 9,950 33.2 %Operating expenses (7,960) 26.5Net operating income $ 1,990 6.6 %Interest expense (940) 3.1Earnings before taxes $ 1,050 3.5 %Income taxes (382) 1.3Net income $668 2.2 % Specifically, write up a brief narrative that responds to the following questions: a. How much cash does Patterson have on hand relative to its total…arrow_forwardces The financial statements of Friendly Fashions include the following selected data (in millions): ($ in millions) Sales Net income Stockholders' equity Average Shares outstanding (in millions) Dividends per share Stock price FRIENDLY FASHIONS Return on equity Numerator/Denominator Dividend yield Numerator/Denominator Required: Calculate the following ratios for Friendly Fashions in 2024. (Enter your dividend yield and price-earnings ratio values to 2 decimal places. Enter your answers in millions (i.e. 5,500,000 should be entered as 5.5).) Earnings per share Numerator/Denominator Price-earnings ratio Numerator/Denominator Amounts Amounts Amounts 2024 $8,943 $310 $1,680 Amounts 680 $0.40 $7.00 2023 $10,034 $708 $2,320 0 0 0arrow_forward
- Computing earnings per share, price/earnings ratio, and rate of return on common stockholders’ equity Gullo Company reported these figures for 2018 and 2017: Requirements Compute Gullo Company’s earnings per share for 2018. Assume the company paid the minimum preferred dividend during 2018. Round to the nearest cent. Compute Gullo Company’s price/earnings ratio for 2018. Assume the company’s market price per share of common stock is $9. Round to two decimals. Compute Gullo Company’s rate of return on common stockholders’ equity for 2018. Assume the company paid the minimum preferred dividend during 2018. Round to the nearest whole percent.arrow_forwardThe financial statements of Trail Apparel include the following selected data (in millions): ($ in thousands, except stock price) 2021 Sales $ Net income Dividends Stockholders' equity, end of year Shares outstanding Average stock price $ 1. Return on equity % 2. Dividend yield % 3. Earnings per share 4. Price-earnings ratio 728,720 16,100 4,320 244,150 47,000 5.50 2020 $ 752,858 14,420 3,320 231,450 36,000 4.10 Required: Calculate the following amounts for 2021: (Round 'Earning Per Share' to 2 decimal places.)arrow_forwardUse the following information in the table below to answer the question: Blanc Blanc Financial Year ending 2018 2019 Market Price $33.17 $36.08 Total shares outstanding 5,000,000 5,000,000 Total shareholders' equity $63,000,000.00 $68,500,000.00 Net Income $6,940,402.49 $7,393,972.75 Based on the information given the Accounting Return on Equity for Blanc in 2019 is closest to: A. 7.60% О В. 11.25% О с. 3.50%arrow_forward
- Rebert Inc. showed the following balances for last year: Reberts net income for last year was 3,182,000. Refer to the information for Rebert Inc. above. Required: 1. Calculate the average common stockholders equity. 2. Calculate the return on stockholders equity.arrow_forwardThe income statement, statement of retained earnings, and balance sheet for Somerville Company are as follows: Includes both state and federal taxes. Brief Exercise 15-20 Calculating the Average Common Stockholders Equity and the Return on Stockholders Equity Refer to the information for Somerville Company on the previous pages. Required: Note: Round answers to four decimal places. 1. Calculate the average common stockholders equity. 2. Calculate the return on stockholders equity.arrow_forwardSuppose the following financial information is available for Walgreen Company. (in millions) 2017 2016 Average common stockholders' equity $12,990.0 $11,690.0 Dividends declared for common stockholders 545 390 Dividends declared for preferred stockholders Net income 1,895 2,195 Calculate the payout ratio and return on common stockholders' equity for 2017 and 2016. (Round answers to 1 decimal place, e.g. 12.5%.) 2017 2016 Payout ratioarrow_forward
arrow_back_ios
SEE MORE QUESTIONS
arrow_forward_ios
Recommended textbooks for you
 Century 21 Accounting Multicolumn JournalAccountingISBN:9781337679503Author:GilbertsonPublisher:Cengage
 Financial Accounting: The Impact on Decision Make...AccountingISBN:9781305654174Author:Gary A. Porter, Curtis L. NortonPublisher:Cengage Learning
 Cornerstones of Financial AccountingAccountingISBN:9781337690881Author:Jay Rich, Jeff JonesPublisher:Cengage Learning
 Managerial Accounting: The Cornerstone of Busines...AccountingISBN:9781337115773Author:Maryanne M. Mowen, Don R. Hansen, Dan L. HeitgerPublisher:Cengage Learning
Century 21 Accounting Multicolumn Journal
Accounting
ISBN:9781337679503
Author:Gilbertson
Publisher:Cengage
Financial Accounting: The Impact on Decision Make...
Accounting
ISBN:9781305654174
Author:Gary A. Porter, Curtis L. Norton
Publisher:Cengage Learning
Cornerstones of Financial Accounting
Accounting
ISBN:9781337690881
Author:Jay Rich, Jeff Jones
Publisher:Cengage Learning
Managerial Accounting: The Cornerstone of Busines...
Accounting
ISBN:9781337115773
Author:Maryanne M. Mowen, Don R. Hansen, Dan L. Heitger
Publisher:Cengage Learning
Financial ratio analysis; Author: The Finance Storyteller;https://www.youtube.com/watch?v=MTq7HuvoGck;License: Standard Youtube License