
Financial Accounting, Student Value Edition Plus MyLab Accounting with Pearson eText -- Access Card Package (12th Edition)
12th Edition
ISBN: 9780134833156
Author: C. William Thomas, Wendy M. Tietz, Walter T. Harrison Jr.
Publisher: PEARSON
expand_more
expand_more
format_list_bulleted
Videos
Textbook Question
Chapter 12, Problem 12.62BP
Group B
LO 1, 2, 4
(Learning Objectives 1, 2, 4: Calculate trend percentages, return on sales, asset turnover, and ROA, and compare with industry averages) Net sales, net income, and total assets for Suburban Shipping, Inc., for a five-year period follow
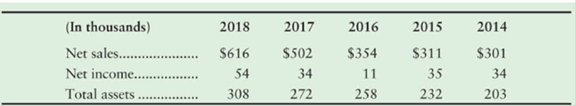
Requirements
- 1. Calculate trend percentages for each item for 2015 through 2018. Use 2014 as the base year and round to the nearest percent.
- 2. Calculate the
rate of return on net sales for 2016 through 2018, rounding to three decimal places. Explain what this means. - 3. Calculate asset turnover for 2016 through 2018. Explain what this means.
- 4. Use a DuPont Analysis to calculate the rate of return on average total assets (ROA) for 2016 through 2018.
- 5. How does Suburban Shipping’s return on net sales for 2018 compare with previous years? How does it compare with that of the industry? In the shipping industry, rates above 9% are considered good, and rates above 11% are outstanding.
- 6. Evaluate the company’s ROA for 2018, compared with previous years and against an 18% benchmark for the industry.
Expert Solution & Answer

Trending nowThis is a popular solution!

Students have asked these similar questions
OBJECTIVE: To enable learners to utilize financial ratios as a mechanism to evaluate the firm's financial
performance and identify areas for making decisions for improvement
REQUIREMENT: Financial Statement Analysis
Question
Refer to the following financial statements of Delima Corporation for 2019 and 2020:
Delima Corporation
Income Statements
For the year ended 31 December (in millions)
2020
$13,198
7,750
2019
$12,397
7,108
Net sales
Cost of goods sold
Gross profit
Selling and administrative expenses
Income from operations
5,448
5,289
3,472
3,299
1,976
1,990
Interest expense
233
248
Other (income) expense, net
11
1,732
503
1,229
Income before income taxes
1,742
Income tax expense
502
Net income
1,240
Delima Corporation
Balance Sheets
31 December (in millions)
2020
2019
Assets
Current assets
Cash
$460
$444
Accounts receivables (net)
1,188
1,132
1,190
1,056
225
2,915
3,128
Inventories
Other current assets
247
Total current assets
3,027
3,281
Property (net)
5,593
$11,901
Other assets…
E12-24B Vertical analysis (Learning Objective 2) 15-20 min.
Simpson Painting, Inc., requested that you perform a vertical analysis
of its balance sheet to determine the component percentages of its
assets, liabilities, and stockholders' equity. Round to the nearest tenth
of a percent.
P. Donnelly, Inc.
Comparative Income Statement
Years Ended December 31, 2018 and 2017
Revenue
Expenses:
Cost of Goods Sold
Selling and General Expenses
Interest Expense
Income Tax Expense
Total Expenses
Net Income
2018
$500,000
$245,000
111,000
10,000
54,700
420,700
$ 79,300
2017
$439,500
$236,000
103,500
6,500
44,400
390,400
$ 49,100
1. Using the data in the student spreadsheet file Ethan Allen Financials.xlsx forecast the 2019 income statement and balance sheet for Ethan Allen. Use the percent of sales method and the following assumptions: (1) sales in FY 2019 will be $797.3359; (2) the tax rate will be 35%; (3) each item that changes with sales will be the five-year average percentage of sales; (4) net fixed assets will increase to $300; and (5) the common dividend will be $0.75 per share. Use your judgment on all other items. a. What is the discretionary financing needed in 2019? Is this a surplus or deficit? b. Assume that the DFN will be absorbed by long-term debt and that the interest rate is 4% of LTD. Set up an iterative worksheet to eliminate it.
Chapter 12 Solutions
Financial Accounting, Student Value Edition Plus MyLab Accounting with Pearson eText -- Access Card Package (12th Edition)
Ch. 12 - Prob. 1QCCh. 12 - Prob. 2QCCh. 12 - Prob. 3QCCh. 12 - Prob. 4QCCh. 12 - Expressing accounts receivable as a percentage of...Ch. 12 - Kincaid Company reported the following data (in...Ch. 12 - Prob. 7QCCh. 12 - Ratios that measure liquidity include all of the...Ch. 12 - Verba Corporation has an inventory turnover of 15...Ch. 12 - The measure of a companys ability to collect cash...
Ch. 12 - A ratio that measures a companys profitability is...Ch. 12 - Prob. 12QCCh. 12 - Prob. 13QCCh. 12 - Prob. 14QCCh. 12 - Prob. 12.1ECCh. 12 - Prob. 12.1SCh. 12 - Prob. 12.2SCh. 12 - Prob. 12.3SCh. 12 - Prob. 12.4SCh. 12 - Prob. 12.5SCh. 12 - (Learning Objective 4: Evaluate a companys quick...Ch. 12 - Prob. 12.7SCh. 12 - (Learning Objective 4: Measure ability to pay...Ch. 12 - (Learning Objective 4: Measure profitability using...Ch. 12 - Prob. 12.10SCh. 12 - (Learning Objective 4: Use ratio data to...Ch. 12 - Prob. 12.12SCh. 12 - (Learning Objective 4: Analyze a company based on...Ch. 12 - Prob. 12.14SCh. 12 - Prob. 12.15SCh. 12 - Prob. 12.16AECh. 12 - Prob. 12.17AECh. 12 - Prob. 12.18AECh. 12 - Prob. 12.19AECh. 12 - Prob. 12.20AECh. 12 - Prob. 12.21AECh. 12 - Prob. 12.22AECh. 12 - Prob. 12.23AECh. 12 - Prob. 12.24AECh. 12 - Prob. 12.25AECh. 12 - Prob. 12.26AECh. 12 - Prob. 12.27BECh. 12 - Prob. 12.28BECh. 12 - Prob. 12.29BECh. 12 - Prob. 12.30BECh. 12 - Prob. 12.31BECh. 12 - LO 4 (Learning Objective 4: Calculate ratios;...Ch. 12 - Prob. 12.33BECh. 12 - Prob. 12.34BECh. 12 - Prob. 12.35BECh. 12 - Prob. 12.36BECh. 12 - Prob. 12.37BECh. 12 - Prob. 12.38QCh. 12 - Prob. 12.39QCh. 12 - Prob. 12.40QCh. 12 - Prob. 12.41QCh. 12 - Prob. 12.42QCh. 12 - Prob. 12.43QCh. 12 - Prob. 12.44QCh. 12 - Use the Orlando Medical Corporation financial...Ch. 12 - Prob. 12.46QCh. 12 - Use the Orlando Medical Corporation financial...Ch. 12 - Prob. 12.48QCh. 12 - Prob. 12.49QCh. 12 - Prob. 12.50QCh. 12 - Prob. 12.51QCh. 12 - Prob. 12.52QCh. 12 - Prob. 12.53QCh. 12 - Prob. 12.54QCh. 12 - Prob. 12.55QCh. 12 - LO 1, 2, 4 (Learning Objectives 1, 2, 4: Calculate...Ch. 12 - Prob. 12.57APCh. 12 - Prob. 12.58APCh. 12 - LO 4 (Learning Objective 4: Use ratios to evaluate...Ch. 12 - Prob. 12.60APCh. 12 - LO 2, 4, 5 (Learning Objectives 2, 4, 5: Analyze...Ch. 12 - Group B LO 1, 2, 4 (Learning Objectives 1, 2, 4:...Ch. 12 - Prob. 12.63BPCh. 12 - Prob. 12.64BPCh. 12 - LO 4 (Learning Objective 4: Use ratios to evaluate...Ch. 12 - Prob. 12.66BPCh. 12 - LO 2, 4, 5 (Learning Objectives 2, 4, 5: Analyze...Ch. 12 - Prob. 12.68CEPCh. 12 - Prob. 12.69CEPCh. 12 - (Learning Objectives 2, 3.4: Use trend...Ch. 12 - (Learning Objectives 4, 5: Calculate and analyze...Ch. 12 - Prob. 12.72DCCh. 12 - Prob. 12.73DCCh. 12 - Prob. 12.74EICCh. 12 - Focus on Financials Apple Inc. LO 1, 2, 3, 4, 5...Ch. 12 - Comprehensive Financial Statement Analysis Project...
Knowledge Booster


Learn more about
Need a deep-dive on the concept behind this application? Look no further. Learn more about this topic, accounting and related others by exploring similar questions and additional content below.Similar questions
- Examine the selected data over the 5-year period as shown in the table below for Dumbledore Ltd. Item Sales Cost of sales EBIT Interest NPAT Current assets Total assets current liabilities Total liabilities Equity Gross margin Interest coverage Current ratio 2021 $m 286.41 180.03 51.18 37.07 35.13 43.85 226.18 55.99 98.99 127.19 0.37 1.38 0.78 Year 2020 $m 280.80 166.69 51.08 33.70 35.10 43.20 221.75 53.58 91.66 130.09 0.41 1.52 0.81 2019 $m 275.29 154.35 50.98 30.64 35.06 42.56 217.40 51.27 84.87 132.53 0.44 1.66 0.89 2018 $m 269.89 142.91 50.88 27.85 35.03 41.93 213.13 49.06 78.58 134.56 0.47 1.83 U.OJ 2017 $m 264.60 134.19 49.88 25.32 34.51 41.31 206.93 47.40 74.48 132.44 0.49 1.97 0.87 2016 $m 252.00 126.00 48.90 24.00 34.00 40.70 200.90 45.80 70.60 130.30 0.50 2.04 0.89arrow_forwardProblem 1: Viance Queen Company Required: Compute for the company’s profitability and operating efficiency ratios for 2019 Compute for the financial health ratios of the company for 2019 A.Profitability ratio a. Return on Assets: ROA (NI/Total Assets) ROA (NI/Average Assets) ROA (EBIT/Total Assets) ROA (EBIT/Average Assets) ROE (NI/Capital) ROE (NI/Average Capitalarrow_forwardProblem 1: Viance Queen Company Required: Compute for the company’s profitability and operating efficiency ratios for 2019 Compute for the financial health ratios of the company for 2019 B.Operating Efficiency Days in Inventory AR Turnover Days in ARarrow_forward
- Problem 1: Viance Queen Company Required: Compute for the company’s profitability and operating efficiency ratios for 2019 Compute for the financial health ratios of the company for 2019 A.Profitability ratio a.Gross Profit Ratio b. Operating income margin c. Net profit margin d. Return on Assets: ROA (NI/Total Assets) ROA (NI/Average Assets) ROA (EBIT/Total Assets) ROA (EBIT/Average Assets) ROE (NI/Capital) ROE (NI/Average Capital B.Operating Efficiency a. Asset Turnover b. Fixed Asset Turnover c. Inventory Turnover d. Days in Inventory e. AR Turnover f. Days in AR C.Financial Health/ (Solvency and Liquidity) Solvency ratio: a. Debt to equity ratio b. Debt Ratio c. Equity Ratio d. Interest Coverage Ratio Liquidity ratio: a. Current Ratio b. Quick Ratioarrow_forward(Learning Objective 2: Analyze accounts payable turnover) Barnacle Sales, Inc.’s,comparative income statements and balance sheets show the following selected information for2017 and 2018:2018$2,850,000$ 800,000$ 600,000$ 305,0002017$2,700,000$ 600,000$ 400,000$ 255,000Cost of goods sold.......................................................Ending inventory.........................................................Beginning inventory ....................................................Average accounts payable ...........................................Requirements1. Calculate the company’s accounts payable turnover and days’ payable outstanding (DPO)for 2017 and 2018.2. On the basis of this computation alone, has the company’s liquidity position improved ordeteriorated during 2018?arrow_forward(Learning Objective 7: Calculate return on assets) Hometown Supply Companyreported the following information in its comparative financial statements for the fiscal yearended January 31, 2018:January 31,2018January 31,2017Net sales....................................Net earnings..............................Average total assets...................$84,000$ 4,200$70,000$82,600$ 4,050$69,450Requirements1. Compute the net profit margin ratio for the years ended January 31, 2018, and 2017. Did itimprove or worsen in 2018?2. Compute asset turnover for the years ended January 31, 2018, and 2017. Did it improve orworsen in 2018?3. Compute return on assets for the years ended January 31, 2018, and 2017. Did it improveor worsen in 2018? Which component—net profit margin ratio or asset turnover—wasmostly responsible for the change in the company’s return on assets?arrow_forward
- (Learning Objective 7: Calculate return on assets) Handley Grocery Corporationreported the following information in its comparative financial statements for the fiscal yearended January 31, 2018:January 31,2018January 31,2017Net sales....................................Net earnings..............................Average total assets...................$50,000$ 2,200$40,000$48,350$ 2,100$39,300Requirements1. Compute the net profit margin ratio for the years ended January 31, 2018, and 2017. Did itimprove or worsen in 2018?2. Compute asset turnover for the years ended January 31, 2018, and 2017. Did it improve orworsen in 2018?3. Compute return on assets for the years ended January 31, 2018, and 2017. Did it improveor worsen in 2018? Which component—net profit margin ratio or asset turnover—wasmostly responsible for the change in the company’s return on assets?arrow_forwardNet sales revenue, net income, and common stockholders' equity for Eyesight Mission Corporation, a manufacturer of contact lenses, follow for a four-year period. E (Click the icon to view the net sales revenue, net income, and common equity) Read the requirements. Requirement 1. Compute trend analyses for each item for 2017 2019 Use 2016 as the base year, and round to the nearest whole percent. Begin by computing Eyesight Mission Corporation's trend analysis for net sales revenue, then compute Eyesight Mission Corporation's trend analysis for net income and finally compute Eyesight Mission Corporation's trend analysis for common stockholders' equity 2019 2018 2017 2016 Net Sales Revenue $4 766,000 $4 708 000 644 000 664,000 Trend Percentages 100 % Requirements 2019 2018 2017 2016 766,000 $ 708,000 $ 644,000 $ 664,000 44,000 Net Sales Revenue $4 Net Income 60,000 38,000 36,000 Ending Common Stockholders' Equity 368,000 352,000 326,000 296,000arrow_forwardGIVE THE FORMULAS FOR THE FOLLOWING EFFICIENCY RATIOS OF NESTLE. THANK YOU Ratio Analysis Efficiency Asset turnover Inventory turnover Receivables turnover Summary of Financial Ratios of Nestle 2020 2019 Average collection period (days) 0.68 4.254 7.849 46.519 0.724 4.993 7.867 46.323 Industry Average 449 days 68 days 34 daysarrow_forward
- 8. Trend Ratios, Application of some Financial Ratios and their Interpretation Some of the balance sheet and income statement figures of Sapphire Mfg. CO. for 2016, 2017 and 20181 are as follows. 2018 P30,000 2016 2017 Quick assets P40,000 P48,000 65,000 25,000 80,000 50,000 Current assets 50,000 40,000 110,000 200,000 Investments 160,000 135,000 Plants, property and equipment, net Total assets 250,000 265,000 Current liabilities 45,000 50,000 100,000 75,000 Long Term debt Total stockholders' equity 40,000 50,000 105,000 125,000 125,000 Total liabilities and stockholders' Equity 200,000 400,000 240,000 250,000 265,000 Sales 375,000 500,000 Cost of goods sold Operating expenses (including Depreciation of P10,000) 255,000 290,000 110,000 95,000 105,000 Net income 50,000 50,000 130,000 a) Compute for the trend ratios based on the above given data and give your interpretation of the 2017 and 2018 figures.arrow_forwardA company’s data of year wise profit is provided; you have to find out how much profit the company should earn in year 2022 to get total profit of 25000? Use goal seek to solve this problem. Show all formulas used in Excel Take the screen shot of the goal seek window when display result. Year Profit 2019 5000 2000 6000 2021 7000 2022 Total Profit 18000arrow_forwardDon Williams received a memo requesting that he complete a trend analysis of the following numbers using 2021 as the base year. Sales Gross profit Net income 2024 $ 390,000 210,000 41,100 Could you help Don with the request? 2024 Sales Gross profit Net income % % % 2023 $ 462,000 285,000 53,100 2023 % % % 2022 2022 $ 486,000 410,000 23,100 % % % 2021 2021 $ 600,000 500,000 30,000 100 % 100 % 100 %arrow_forward
arrow_back_ios
SEE MORE QUESTIONS
arrow_forward_ios
Recommended textbooks for you
 Cornerstones of Financial AccountingAccountingISBN:9781337690881Author:Jay Rich, Jeff JonesPublisher:Cengage Learning
 Financial Reporting, Financial Statement Analysis...FinanceISBN:9781285190907Author:James M. Wahlen, Stephen P. Baginski, Mark BradshawPublisher:Cengage Learning
Cornerstones of Financial Accounting
Accounting
ISBN:9781337690881
Author:Jay Rich, Jeff Jones
Publisher:Cengage Learning
Financial Reporting, Financial Statement Analysis...
Finance
ISBN:9781285190907
Author:James M. Wahlen, Stephen P. Baginski, Mark Bradshaw
Publisher:Cengage Learning
Financial Projections for Startups Basic Walkthrough; Author: Mike Lingle;https://www.youtube.com/watch?v=7avegQF4dxI;License: Standard youtube license