
APPLIED STAT.IN BUS.+ECONOMICS
6th Edition
ISBN: 9781259957598
Author: DOANE
Publisher: RENT MCG
expand_more
expand_more
format_list_bulleted
Videos
Textbook Question
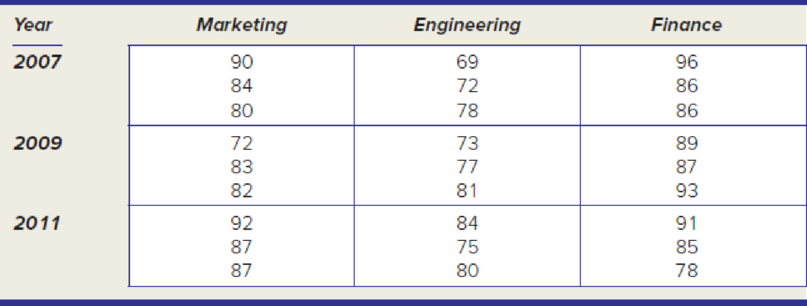
Chapter 11.6, Problem 26SE
Instructions: For each data set: (a) State the hypotheses. (b) Use Excel’s Data Analysis (or other software) to perform the two-factor ANOVA with replication, using α = .05. (c) State your conclusions about the main effects and interaction effects. (d) Interpret the p-values carefully. Ambitious students: (e*) Create interaction plots and interpret them.
Oxnard Petro, Ltd., has three interdisciplinary project development teams that
Expert Solution & Answer
Want to see the full answer?
Check out a sample textbook solution
Students have asked these similar questions
1.2.17. (!) Let G,, be the graph whose vertices are the permutations of (1,..., n}, with
two permutations a₁, ..., a,, and b₁, ..., b, adjacent if they differ by interchanging a pair
of adjacent entries (G3 shown below). Prove that G,, is connected.
132
123
213
312
321
231
You are planning an experiment to determine the effect of the brand of gasoline and the weight of a car on gas mileage measured in miles per gallon. You will use a single test car, adding weights so that its total weight is 3000, 3500, or 4000 pounds. The car will drive on a test track at each weight using each of Amoco, Marathon, and Speedway gasoline. Which is the best way to organize the study?
Start with 3000 pounds and Amoco and run the car on the test track. Then do 3500 and 4000 pounds. Change to Marathon and go through the three weights in order. Then change to Speedway and do the three weights in order once more.
Start with 3000 pounds and Amoco and run the car on the test track. Then change to Marathon and then to Speedway without changing the weight. Then add weights to get 3500 pounds and go through the three gasolines in the same order.Then change to 4000 pounds and do the three gasolines in order again.
Choose a gasoline at random, and run the car with this gasoline at…
AP1.2 A child is 40 inches tall, which places her at the 90th percentile of all children of similar age. The heights for children of this age form an approximately Normal distribution with a mean of 38 inches. Based on this information, what is the standard deviation of the heights of all children of this age?
0.20 inches (c) 0.65 inches (e) 1.56 inches
0.31 inches (d) 1.21 inches
Chapter 11 Solutions
APPLIED STAT.IN BUS.+ECONOMICS
Ch. 11.2 - Using the following Excel results: (a) What was...Ch. 11.2 - Using the following Excel results: (a) What was...Ch. 11.2 - In a one-factor ANOVA with sample sizes n1 = 5, n2...Ch. 11.2 - In a one-factor ANOVA with sample sizes n1 = 8, n2...Ch. 11.2 - Prob. 5SECh. 11.2 - Prob. 6SECh. 11.2 - Instructions for Exercises 11.5 through 11.8: Use...Ch. 11.2 - Prob. 8SECh. 11.3 - Consider a one-factor ANOVA with n1 = 9, n2 = 10,...Ch. 11.3 - Consider a one-factor ANOVA with n1 = 6, n2 = 5,...
Ch. 11.3 - Prob. 11SECh. 11.3 - Prob. 12SECh. 11.3 - Prob. 13SECh. 11.3 - Prob. 14SECh. 11.4 - In a one-factor ANOVA with n1 = 6, n2 = 4, and n3...Ch. 11.4 - Prob. 16SECh. 11.4 - Prob. 17SECh. 11.4 - Prob. 18SECh. 11.4 - Instructions for Exercises 11.17 through 11.20:...Ch. 11.4 - Instructions for Exercises 11.17 through 11.20:...Ch. 11.5 - Prob. 21SECh. 11.5 - Prob. 22SECh. 11.5 - Prob. 23SECh. 11.5 - Prob. 24SECh. 11.6 - Instructions: For each data set: (a) State the...Ch. 11.6 - Instructions: For each data set: (a) State the...Ch. 11.6 - Prob. 27SECh. 11.6 - Prob. 28SECh. 11 - Explain each term: (a) explained variation; (b)...Ch. 11 - (a) Explain the difference between one-factor and...Ch. 11 - (a) State three assumptions of ANOVA. (b) What do...Ch. 11 - (a) Sketch the format of a one-factor ANOVA data...Ch. 11 - (a) Sketch the format of a two-factor ANOVA data...Ch. 11 - (a) Sketch the format of a two-factor ANOVA data...Ch. 11 - Prob. 7CRCh. 11 - (a) What does a test for homogeneity of variances...Ch. 11 - What is the general linear model and why is it...Ch. 11 - (a) What is a 2k design, and what are its...Ch. 11 - Instructions: You may use Excel, MegaStat,...Ch. 11 - Instructions: You may use Excel, MegaStat,...Ch. 11 - Instructions: You may use Excel, MegaStat,...Ch. 11 - Instructions: You may use Excel, MegaStat,...Ch. 11 - Instructions: You may use Excel, MegaStat,...Ch. 11 - Instructions: You may use Excel, MegaStat,...Ch. 11 - Instructions: You may use Excel, MegaStat,...Ch. 11 - Instructions: You may use Excel, MegaStat,...Ch. 11 - Instructions: You may use Excel, MegaStat,...Ch. 11 - Instructions: You may use Excel, MegaStat,...Ch. 11 - Instructions: You may use Excel, MegaStat,...Ch. 11 - Instructions: You may use Excel, MegaStat,...Ch. 11 - Instructions: You may use Excel, MegaStat,...Ch. 11 - Instructions: You may use Excel, MegaStat,...Ch. 11 - Instructions: You may use Excel, MegaStat,...Ch. 11 - Instructions: You may use Excel, MegaStat,...Ch. 11 - Instructions: You may use Excel, MegaStat,...Ch. 11 - In a market research study, members of a consumer...Ch. 11 - Prob. 47CECh. 11 - (a) What kind of ANOVA is this (one-factor,...Ch. 11 - Here is an Excel ANOVA table for an experiment to...Ch. 11 - Several friends go bowling several times per...Ch. 11 - Prob. 51CECh. 11 - A company has several suppliers of office...Ch. 11 - Several friends go bowling several times per...Ch. 11 - Are large companies more profitable per dollar of...
Knowledge Booster


Learn more about
Need a deep-dive on the concept behind this application? Look no further. Learn more about this topic, statistics and related others by exploring similar questions and additional content below.Similar questions
- AP1.1 You look at real estate ads for houses in Sarasota, Florida. Many houses range from $200,000 to $400,000 in price. The few houses on the water, however, have prices up to $15 million. Which of the following statements best describes the distribution of home prices in Sarasota? The distribution is most likely skewed to the left, and the mean is greater than the median. The distribution is most likely skewed to the left, and the mean is less than the median. The distribution is roughly symmetric with a few high outliers, and the mean is approximately equal to the median. The distribution is most likely skewed to the right, and the mean is greater than the median. The distribution is most likely skewed to the right, and the mean is less than the median.arrow_forwardDuring busy political seasons, many opinion polls are conducted. In apresidential race, how do you think the participants in polls are generally selected?Discuss any issues regarding simple random, stratified, systematic, cluster, andconvenience sampling in these polls. What about other types of polls, besides political?arrow_forwardPlease could you explain why 0.5 was added to each upper limpit of the intervals.Thanksarrow_forward
- 28. (a) Under what conditions do we say that two random variables X and Y are independent? (b) Demonstrate that if X and Y are independent, then it follows that E(XY) = E(X)E(Y); (e) Show by a counter example that the converse of (ii) is not necessarily true.arrow_forward1. Let X and Y be random variables and suppose that A = F. Prove that Z XI(A)+YI(A) is a random variable.arrow_forward30. (a) What is meant by the term "product measur"? ANDarrow_forward
arrow_back_ios
SEE MORE QUESTIONS
arrow_forward_ios
Recommended textbooks for you
 Glencoe Algebra 1, Student Edition, 9780079039897...AlgebraISBN:9780079039897Author:CarterPublisher:McGraw Hill
 Big Ideas Math A Bridge To Success Algebra 1: Stu...AlgebraISBN:9781680331141Author:HOUGHTON MIFFLIN HARCOURTPublisher:Houghton Mifflin Harcourt
Glencoe Algebra 1, Student Edition, 9780079039897...
Algebra
ISBN:9780079039897
Author:Carter
Publisher:McGraw Hill
Big Ideas Math A Bridge To Success Algebra 1: Stu...
Algebra
ISBN:9781680331141
Author:HOUGHTON MIFFLIN HARCOURT
Publisher:Houghton Mifflin Harcourt
Hypothesis Testing using Confidence Interval Approach; Author: BUM2413 Applied Statistics UMP;https://www.youtube.com/watch?v=Hq1l3e9pLyY;License: Standard YouTube License, CC-BY
Hypothesis Testing - Difference of Two Means - Student's -Distribution & Normal Distribution; Author: The Organic Chemistry Tutor;https://www.youtube.com/watch?v=UcZwyzwWU7o;License: Standard Youtube License