
Concept explainers
Videos
Instructions: You may use Excel, MegaStat, Minitab, JMP, or another computer package of your choice. Attach appropriate copies of the output or capture the screens, tables, and relevant graphs and include them in a written report. Try to state your conclusions succinctly in language that would be clear to a decision maker who is a nonstatistician. Exercises marked * are based on optional material. Answer the following questions, or those your instructor assigns.
- a. Choose an appropriate ANOVA model. State the hypotheses to be tested.
- b. Display the data visually (e.g., dot plots or line plots by factor). What do the displays show?
- c. Do the ANOVA calculations using the computer.
- d. State the decision rule for α = .05 and make the decision. Interpret the p-value.
- e. In your judgment, are the observed differences in treatment means (if any) large enough to be of practical importance?
- f. Given the nature of the data, would more data collection be practical?
- g. Perform Tukey multiple comparison tests and discuss the results.
- h. Perform a test for homogeneity of variances. Explain fully.
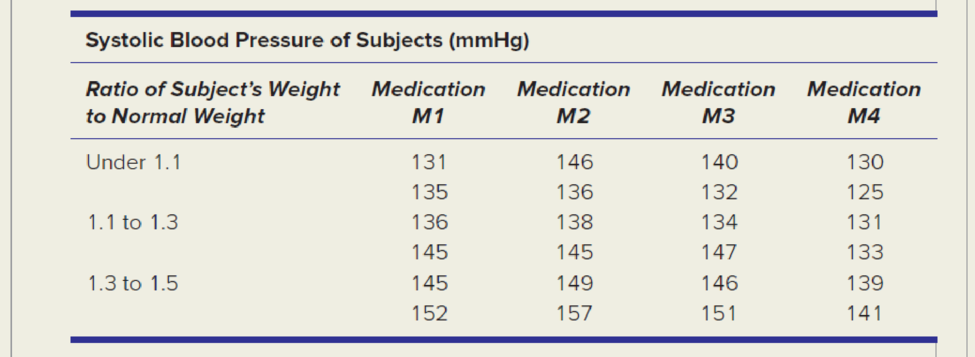
To check pain-relieving medications for potential side effects on blood pressure, it is decided to give equal doses of each of four medications to test subjects. To control for the potential effect of weight, subjects are classified by weight groups. Subjects are approximately the same age and are in general good health. Two subjects in each category are chosen at random from a large group of male prison volunteers. Subjects’ blood pressures 15 minutes after the dose are shown below. Research question: Is mean blood pressure affected by body weight and/or by medication type?
Want to see the full answer?
Check out a sample textbook solution
Chapter 11 Solutions
APPLIED STAT.IN BUS.+ECONOMICS


- Interpret the table following the suggested guidlines.arrow_forwardFor the three-part question that follows, provide your answer to each question in the given workspace. Identify each part with a coordinating response. Be sure to clearly label each part of your response as Part A, Part B, and Part C.Use the set of data to answer the following questions.arrow_forwardQ1. Write aims of data classification ?arrow_forward
- Suppose you need to summarize ordinal data in a bar graph. How would you arrange the categories of data on the horizontal axis? Is it possible to make the order of the data apparent in a pie chart?arrow_forwardThe data set shows the numbers of flowers that students on a field trip correctly identified. What is the mode of the data set?arrow_forward
 Glencoe Algebra 1, Student Edition, 9780079039897...AlgebraISBN:9780079039897Author:CarterPublisher:McGraw Hill
 Elementary Geometry For College Students, 7eGeometryISBN:9781337614085Author:Alexander, Daniel C.; Koeberlein, Geralyn M.Publisher:Cengage,
 Holt Mcdougal Larson Pre-algebra: Student Edition...AlgebraISBN:9780547587776Author:HOLT MCDOUGALPublisher:HOLT MCDOUGAL
 Algebra: Structure And Method, Book 1AlgebraISBN:9780395977224Author:Richard G. Brown, Mary P. Dolciani, Robert H. Sorgenfrey, William L. ColePublisher:McDougal Littell