APPLIED STAT.IN BUS.+ECONOMICS
6th Edition
ISBN: 9781259957598
Author: DOANE
Publisher: RENT MCG
bartleby

Concept explainers

bartleby

Videos

Textbook Question
Book Icon
Chapter 11, Problem 34CE

Instructions: You may use Excel, MegaStat, Minitab, JMP, or another computer package of your choice. Attach appropriate copies of the output or capture the screens, tables, and relevant graphs and include them in a written report. Try to state your conclusions succinctly in language that would be clear to a decision maker who is a nonstatistician. Exercises marked * are based on optional material. Answer the following questions, or those your instructor assigns.

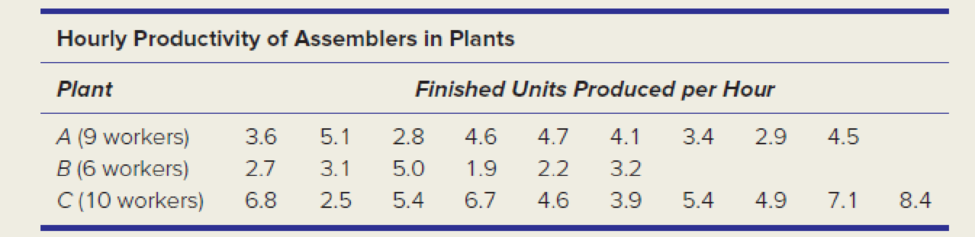
  1. a. Choose an appropriate ANOVA model. State the hypotheses to be tested.
  2. b. Display the data visually (e.g., dot plots or line plots by factor). What do the displays show?
  3. c. Do the ANOVA calculations using the computer.
  4. d. State the decision rule for α = .05 and make the decision. Interpret the p-value.
  5. e. In your judgment, are the observed differences in treatment means (if any) large enough to be of practical importance?
  6. f. Given the nature of the data, would more data collection be practical?
  7. g. Perform Tukey multiple comparison tests and discuss the results.
  8. h. Perform a test for homogeneity of variances. Explain fully.

The results shown below are mean productivity measurements (average number of assemblies completed per hour) for a random sample of workers at each of three plants. Research question: Are the mean hourly productivity levels the same for workers in these three plants?

Chapter 11, Problem 34CE, Instructions: You may use Excel, MegaStat, Minitab, JMP, or another computer package of your choice.

Blurred answer
Students have asked these similar questions
Continue monitoring the process. A second ten days of data have been collected, see table labeled “2nd 10 Days of Monitoring Reservation Processing Time” in the Data File. Develop Xbar and R charts for the 2nd 10 days of monitoring. Plot the data for the 2nd 10 days on the Xbar and R charts. Is the reservation process for the 2nd 10 days of monitoring in control?  If the control chart indicates an out-of-control process, note which days, the pattern, and whether it is the Xbar or R chart.   Based on the X-bar and R Charts that you developed for the 2nd 10 days of data, is the process in control?   Group of answer choices No. The X-bar and R Charts are both out of control. No. The X-bar Chart is in control, but the R Chart is out of control. No. The R Chart is in control, but the X-bar Chart is out of control. Yes. The X-bar and R Charts are both in control.
State at least one type of conclusion that could be made from the data provided for the KPI. Suggest one other data source that would provide more information to make data-driven decisions. Explain what information that source would supply.      (The blue one is mine) or pretty much what can be said of the clustered bar chart
For the three-part question that follows, provide your answer to each question in the given workspace. Identify each part with a coordinating response. Be sure to clearly label each part of your response as Part A, Part B, and Part C.Use the set of data to answer the following questions.

Chapter 11 Solutions

APPLIED STAT.IN BUS.+ECONOMICS

Ch. 11.3 - Prob. 11SECh. 11.3 - Prob. 12SECh. 11.3 - Prob. 13SECh. 11.3 - Prob. 14SECh. 11.4 - In a one-factor ANOVA with n1 = 6, n2 = 4, and n3...Ch. 11.4 - Prob. 16SECh. 11.4 - Prob. 17SECh. 11.4 - Prob. 18SECh. 11.4 - Instructions for Exercises 11.17 through 11.20:...Ch. 11.4 - Instructions for Exercises 11.17 through 11.20:...Ch. 11.5 - Prob. 21SECh. 11.5 - Prob. 22SECh. 11.5 - Prob. 23SECh. 11.5 - Prob. 24SECh. 11.6 - Instructions: For each data set: (a) State the...Ch. 11.6 - Instructions: For each data set: (a) State the...Ch. 11.6 - Prob. 27SECh. 11.6 - Prob. 28SECh. 11 - Explain each term: (a) explained variation; (b)...Ch. 11 - (a) Explain the difference between one-factor and...Ch. 11 - (a) State three assumptions of ANOVA. (b) What do...Ch. 11 - (a) Sketch the format of a one-factor ANOVA data...Ch. 11 - (a) Sketch the format of a two-factor ANOVA data...Ch. 11 - (a) Sketch the format of a two-factor ANOVA data...Ch. 11 - Prob. 7CRCh. 11 - (a) What does a test for homogeneity of variances...Ch. 11 - What is the general linear model and why is it...Ch. 11 - (a) What is a 2k design, and what are its...Ch. 11 - Instructions: You may use Excel, MegaStat,...Ch. 11 - Instructions: You may use Excel, MegaStat,...Ch. 11 - Instructions: You may use Excel, MegaStat,...Ch. 11 - Instructions: You may use Excel, MegaStat,...Ch. 11 - Instructions: You may use Excel, MegaStat,...Ch. 11 - Instructions: You may use Excel, MegaStat,...Ch. 11 - Instructions: You may use Excel, MegaStat,...Ch. 11 - Instructions: You may use Excel, MegaStat,...Ch. 11 - Instructions: You may use Excel, MegaStat,...Ch. 11 - Instructions: You may use Excel, MegaStat,...Ch. 11 - Instructions: You may use Excel, MegaStat,...Ch. 11 - Instructions: You may use Excel, MegaStat,...Ch. 11 - Instructions: You may use Excel, MegaStat,...Ch. 11 - Instructions: You may use Excel, MegaStat,...Ch. 11 - Instructions: You may use Excel, MegaStat,...Ch. 11 - Instructions: You may use Excel, MegaStat,...Ch. 11 - Instructions: You may use Excel, MegaStat,...Ch. 11 - In a market research study, members of a consumer...Ch. 11 - Prob. 47CECh. 11 - (a) What kind of ANOVA is this (one-factor,...Ch. 11 - Here is an Excel ANOVA table for an experiment to...Ch. 11 - Several friends go bowling several times per...Ch. 11 - Prob. 51CECh. 11 - A company has several suppliers of office...Ch. 11 - Several friends go bowling several times per...Ch. 11 - Are large companies more profitable per dollar of...
Knowledge Booster
Background pattern image
Statistics
Learn more about
Need a deep-dive on the concept behind this application? Look no further. Learn more about this topic, statistics and related others by exploring similar questions and additional content below.
Recommended textbooks for you
Text book image
Glencoe Algebra 1, Student Edition, 9780079039897...
Algebra
ISBN:9780079039897
Author:Carter
Publisher:McGraw Hill
Text book image
Elementary Geometry For College Students, 7e
Geometry
ISBN:9781337614085
Author:Alexander, Daniel C.; Koeberlein, Geralyn M.
Publisher:Cengage,
Text book image
Holt Mcdougal Larson Pre-algebra: Student Edition...
Algebra
ISBN:9780547587776
Author:HOLT MCDOUGAL
Publisher:HOLT MCDOUGAL
Text book image
Algebra: Structure And Method, Book 1
Algebra
ISBN:9780395977224
Author:Richard G. Brown, Mary P. Dolciani, Robert H. Sorgenfrey, William L. Cole
Publisher:McDougal Littell
Find number of persons in a part with 66 handshakes Combinations; Author: Anil Kumar;https://www.youtube.com/watch?v=33TgLi-wp3E;License: Standard YouTube License, CC-BY
Discrete Math 6.3.1 Permutations and Combinations; Author: Kimberly Brehm;https://www.youtube.com/watch?v=J1m9sB5XZQc;License: Standard YouTube License, CC-BY
How to use permutations and combinations; Author: Mario's Math Tutoring;https://www.youtube.com/watch?v=NEGxh_D7yKU;License: Standard YouTube License, CC-BY
Permutations and Combinations | Counting | Don't Memorise; Author: Don't Memorise;https://www.youtube.com/watch?v=0NAASclUm4k;License: Standard Youtube License
Permutations and Combinations Tutorial; Author: The Organic Chemistry Tutor;https://www.youtube.com/watch?v=XJnIdRXUi7A;License: Standard YouTube License, CC-BY