
Videos
Instructions: For each data set: (a) State the hypotheses. (b) Use Excel’s Data Analysis (or other software) to perform the two-factor ANOVA with replication, using a = .05. (c) State your conclusions about the main effects and interaction effects. (d) Interpret the p-values carefully. Ambitious students: (e*) Create interaction plots and interpret them.
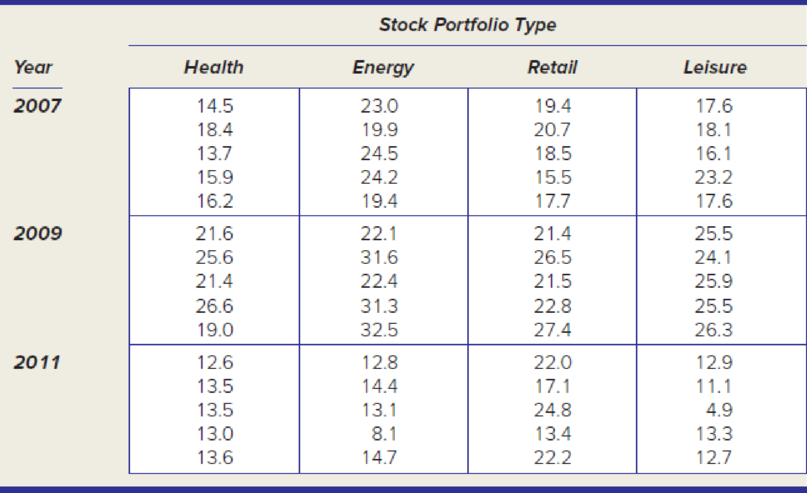
A small independent stock broker has created four sector portfolios for her clients. Each portfolio always has five stocks that may change from year to year. The volatility (coefficient of variation) of each stock is recorded for each year. Are the main effects significant? Is there an interaction?
Want to see the full answer?
Check out a sample textbook solution
Chapter 11 Solutions
APPLIED STAT.IN BUS.+ECONOMICS
Additional Math Textbook Solutions
Elementary Statistics (Text Only)
Statistical Reasoning for Everyday Life (5th Edition)
An Introduction to Mathematical Statistics and Its Applications (6th Edition)
Statistics for Business & Economics, Revised (MindTap Course List)
Stats: Modeling the World Nasta Edition Grades 9-12
Elementary Statistics: A Step By Step Approach


 Glencoe Algebra 1, Student Edition, 9780079039897...AlgebraISBN:9780079039897Author:CarterPublisher:McGraw Hill
 Big Ideas Math A Bridge To Success Algebra 1: Stu...AlgebraISBN:9781680331141Author:HOUGHTON MIFFLIN HARCOURTPublisher:Houghton Mifflin Harcourt
 Holt Mcdougal Larson Pre-algebra: Student Edition...AlgebraISBN:9780547587776Author:HOLT MCDOUGALPublisher:HOLT MCDOUGAL
 College Algebra (MindTap Course List)AlgebraISBN:9781305652231Author:R. David Gustafson, Jeff HughesPublisher:Cengage Learning