
Corporate Finance
12th Edition
ISBN: 9781259918940
Author: Ross, Stephen A.
Publisher: Mcgraw-hill Education,
expand_more
expand_more
format_list_bulleted
Videos
Textbook Question
Chapter 11, Problem 9QAP
Returns and Standard Deviations Consider the following information:
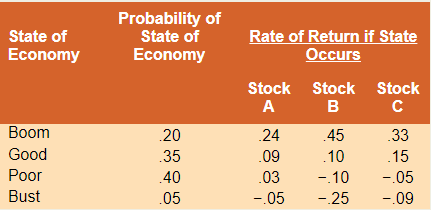
a. Your portfolio is invested 30 percent each in
b. What is the variance of this portfolio? The standard deviation?
Expert Solution & Answer
Want to see the full answer?
Check out a sample textbook solution
Students have asked these similar questions
Expected return and standard deviation. Use the following information to answer the questions:
a. What is the expected return of each asset?
b. What is the variance and the standard deviation of each asset?
c. What is the expected return of a portfolio with 12% in asset J, 52% in asset K, and 36% in asset L?
d. What is the portfolio's variance and standard deviation using the same asset weights from part (c)?
Hint: Make sure to round all intermediate
answers you will type.
a. What is the expected return of asset J?
(Round to four decimal places.)
Data table
(Click on the following icon in order to copy its contents into a spreadsheet.)
Return on
Asset J in
State of
Economy
Boom
Growth
Stagnant
Recession
Probability
of State
0.24
0.36
0.21
0.19
State
0.050
0.050
0.050
0.050
Return on
Asset K in
State
0.230
0.120
0.020
-0.060
Return on
Asset L in
State
0.250
0.190
0.065
- 0.190
An investment has probabilities 0.15, 0.34, 0.44, 0.67, 0.2 and 0.15 of giving returns equal to 50%, 39%, -4%, 20%, -25%, and 42%. What are the expected returns and the standard deviations of returns?
Consider two assets. Suppose that the return on asset 1 has expected value 0.05 and standard deviation 0.1 and suppose that the return on asset 2 has expected value 0.02 and standard deviation 0.05. Suppose that the asset returns have correlation 0.4.Consider a portfolio placing weight w on asset 1 and weight 1-w on asset 2; let Rp denote the return on the portfolio.
Find the mean and variance of Rp as a function of w.
Chapter 11 Solutions
Corporate Finance
Ch. 11 - Diversifiable and Nondiversifiable Risks In broad...Ch. 11 - Systematic versus Unsystematic Risk Classify the...Ch. 11 - Expected Portfolio Returns If a portfolio has a...Ch. 11 - Diversification True or false: The most important...Ch. 11 - Portfolio Risk If a portfolio has a positive...Ch. 11 - Beta and CAPM Is it possible that a risky asset...Ch. 11 - Covariance Briefly explain why the covariance of a...Ch. 11 - Prob. 8CQCh. 11 - Prob. 9CQCh. 11 - Prob. 10CQ
Ch. 11 - Determining Portfolio Weights What are the...Ch. 11 - Portfolio Expected Return You own a portfolio that...Ch. 11 - Prob. 3QAPCh. 11 - Portfolio Expected Return You have 10,000 to...Ch. 11 - Prob. 5QAPCh. 11 - Prob. 6QAPCh. 11 - Calculating Expected Returns A portfolio is...Ch. 11 - Returns and Standard Deviations Consider the...Ch. 11 - Returns and Standard Deviations Consider the...Ch. 11 - Calculating Portfolio Betas You own a stock...Ch. 11 - Calculating Portfolio Betas You own a portfolio...Ch. 11 - Using CAPM A stock has a beta of 1.15, the...Ch. 11 - Prob. 13QAPCh. 11 - Prob. 14QAPCh. 11 - Prob. 15QAPCh. 11 - Using CAPM A stock has a beta of 1.08 and an...Ch. 11 - Prob. 17QAPCh. 11 - Reward-to-Risk Ratios Stock Y has a beta of 1.15...Ch. 11 - Prob. 19QAPCh. 11 - Portfolio Returns Using information from the...Ch. 11 - Prob. 21QAPCh. 11 - Prob. 22QAPCh. 11 - Analyzing a Portfolio You want to create a...Ch. 11 - Prob. 24QAPCh. 11 - Prob. 25QAPCh. 11 - Prob. 26QAPCh. 11 - Prob. 27QAPCh. 11 - Prob. 28QAPCh. 11 - Prob. 29QAPCh. 11 - Prob. 30QAPCh. 11 - Prob. 31QAPCh. 11 - Prob. 32QAPCh. 11 - Prob. 33QAPCh. 11 - Prob. 34QAPCh. 11 - Prob. 35QAPCh. 11 - Prob. 36QAPCh. 11 - Prob. 37QAPCh. 11 - Prob. 38QAPCh. 11 - Prob. 1MCCh. 11 - Prob. 2MC
Knowledge Booster


Learn more about
Need a deep-dive on the concept behind this application? Look no further. Learn more about this topic, finance and related others by exploring similar questions and additional content below.Similar questions
- What is the expected return on a two asset portfolio and what are its variance and standard deviation? Also, What is R squared?arrow_forwardPortfolio Suppose rA ~ N (0.05, 0.01), rB ~ N (0.1, 0.04) with pA,B = 0.2 where rA and rB are CCR’s. a) Suppose you construct a portfolio with 50% for A and 50% for B. Find the variance of the portfolio CCR. b) Find the portfolio expected gross return. c) Find the expected portfolio CCR.arrow_forwardWhat are the (a) expected return, (b) standard deviation, and (c) coefficient of variation for an investment with the following probability distribution? Probability Payoff 0.2 19.0% 0.7 9.0 0.1 4.0arrow_forward
- Calculate the (a) expected return, (b) standard deviation, and (c) coefficient of variation for an investment with the following probability distribution: Probability Payoff 0.45 32.0% 0.35 -4.0% 0.20 -20.0%arrow_forwardFollowing is the portfolio weights, w, percentage expected return in (%), R, vectors and variance-covariance matrix, VC, for a three-asset portfolio: 0.4 12 100 -45 10 w = [0.3], R = [10] and VC = [-45 64 10] 0.3 8 10 10 36 a. Calculate the expected return and standard deviation of the portfolio. b. Suppose an investor requires a target standard deviation of 4% for the portfolio; using the solver function in Excel, find the portfolio weights w to maximise the expected return subject to the constraints Op = 4 and wi + w2 + w3 = 1|arrow_forwardCompute the residual risk measure for portfolio A. Round off your final answer to three digits after the decimal point. Compute the appraisal ratio for portfolio B. Round off your final answer to three digits after the decimal point.arrow_forward
- Portfolios A and B are both well-diversified. The risk-free rate is 8%. The return for the market is 10%. Portfolio A has an expected return of 15% and beta of 1.1. Portfolio B has an expected return of 9% and beta of 0.20. Portfolio A's variance is 9%, whilst Portfolio B's variance is 5.5%. Calculate for Portfolio A and Portfolio B the following: 1. Sharpe's Measure, 2. Treynor's Measure, 3. Jensen's Measure. Which is the better portfolio according to each measure?arrow_forwardAsset K has an expected return of 10 percent and a standard deviation of 28 percent. Asset L has an expected return of 7 percent and a standard deviation of 18 percent. The correlation between the assets is .40. What are the expected return and standard deviation of the minimum variance portfolio?arrow_forwardAssuming the following returns and corresponding probabilities for Asset D: Rate of Return Probability 10% 30% 15% 40% 20% 30% Compute for: a. Expected rate of return b. The standard deviation c. The coefficient of variationarrow_forward
- Possible returns and their probabilities for an asset is given in the table below. The expected return is 30.25%. Calculate the standard deviation of the asset's return. Probability 0.40 0.45 0.15 13.92% O 17.84 % 18.55% O 19.09% 16.59% Return 0.52 0.17 0.12arrow_forwardExpected retun and standard deviation. Use the following information to answer the questions: a. What is the expected return of each asset? b. What is the variance and the standard deviation c. What is the expected return of a portfolio with 1 1 Data Table d. What is the portfolio's variance and standard de - X Hint Make sure to round all intermediate calculatio Swers yo (Click on the following icon D in order to copy its contents into a spreadsheet.) a. What is the expected return of asset J? (Round to four decimal places.) Return on Return on Return on Probability of State State of Asset J in Asset Kin State 0.200 0.140 0.040 Asset L in Economy State State Вoom 0.28 0.070 0.260 0.180 Growth 0.37 0.25 0.070 Stagnant 0.070 0.060 -0.210 Recession 0.10 0.070 -0.100 Print Donearrow_forwardb. What is the variance of this portfolio? The standard deviation? Please show me all steps of the calculations.arrow_forward
arrow_back_ios
SEE MORE QUESTIONS
arrow_forward_ios
Recommended textbooks for you
 Essentials Of InvestmentsFinanceISBN:9781260013924Author:Bodie, Zvi, Kane, Alex, MARCUS, Alan J.Publisher:Mcgraw-hill Education,

 Foundations Of FinanceFinanceISBN:9780134897264Author:KEOWN, Arthur J., Martin, John D., PETTY, J. WilliamPublisher:Pearson,
 Fundamentals of Financial Management (MindTap Cou...FinanceISBN:9781337395250Author:Eugene F. Brigham, Joel F. HoustonPublisher:Cengage Learning
 Corporate Finance (The Mcgraw-hill/Irwin Series i...FinanceISBN:9780077861759Author:Stephen A. Ross Franco Modigliani Professor of Financial Economics Professor, Randolph W Westerfield Robert R. Dockson Deans Chair in Bus. Admin., Jeffrey Jaffe, Bradford D Jordan ProfessorPublisher:McGraw-Hill Education
Essentials Of Investments
Finance
ISBN:9781260013924
Author:Bodie, Zvi, Kane, Alex, MARCUS, Alan J.
Publisher:Mcgraw-hill Education,
Foundations Of Finance
Finance
ISBN:9780134897264
Author:KEOWN, Arthur J., Martin, John D., PETTY, J. William
Publisher:Pearson,
Fundamentals of Financial Management (MindTap Cou...
Finance
ISBN:9781337395250
Author:Eugene F. Brigham, Joel F. Houston
Publisher:Cengage Learning
Corporate Finance (The Mcgraw-hill/Irwin Series i...
Finance
ISBN:9780077861759
Author:Stephen A. Ross Franco Modigliani Professor of Financial Economics Professor, Randolph W Westerfield Robert R. Dockson Deans Chair in Bus. Admin., Jeffrey Jaffe, Bradford D Jordan Professor
Publisher:McGraw-Hill Education
Chapter 8 Risk and Return; Author: Michael Nugent;https://www.youtube.com/watch?v=7n0ciQ54VAI;License: Standard Youtube License