
Corporate Finance (4th Edition) (Pearson Series in Finance) - Standalone book
4th Edition
ISBN: 9780134083278
Author: Jonathan Berk, Peter DeMarzo
Publisher: PEARSON
expand_more
expand_more
format_list_bulleted
Concept explainers
Videos
Textbook Question
Chapter 11, Problem 3P
Consider a world that only consists of the three stocks shown in the following table:
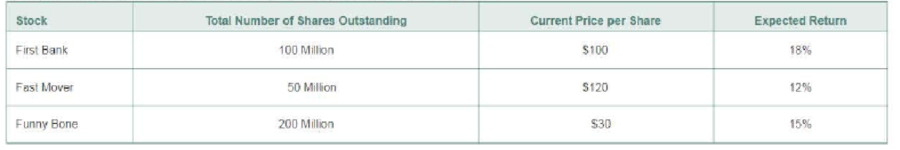
- a. Calculate the total value of all shares outstanding currently.
- b. What fraction of the total value outstanding does each stock make up?
- c. You hold the market portfolio, that is, you have picked portfolio weights equal to the answer to part b (that is each stock’s weight is equal to its contribution to the fraction of the total value of all stocks). What is the expected return of your portfolio?
Expert Solution & Answer
Want to see the full answer?
Check out a sample textbook solution
Students have asked these similar questions
Consider a world that only consists of the three stocks shown in the following table:
a. Calculate the total value of all shares outstanding currently.
b. What fraction of the total value outstanding does each stock make up?
c. You hold the market portfolio, that is, you have picked portfolio weights equal to the answer
the total value of all stocks. What is the expected return of your portfolio?
Data table
(Click on the following icon in order to copy its contents into a spreadsheet.)
Total Number
Current Price per
of Shares Outstanding
Share
Stock
First Bank
Fast Mover
Funny Bone
107 million
46 million
207 million
$111
$120
$30
part with each stock's weight is equal to its contribution to the fraction of
Expected Return
17%
11%
16%
X
Consider a world that only consists of the three stocks shown in the following table:
(1)Calculate the total value of all shares outstanding currently. (2)What fraction of the total value outstanding does each stock make up? (3)You hold the market portfolio, that is, you have picked portfolio weights equal to the answer to part b (that is, each stock’s weight is equal to its contribution to the fraction of the total value of all stocks). What is the expected return of your portfolio?
You a portfolio manager. You have been provided the following information on stock prices and dividends.
Based on the given information, what is the geometric average return on this stock? Please show all the calculations by which you came up with the final answer.
Chapter 11 Solutions
Corporate Finance (4th Edition) (Pearson Series in Finance) - Standalone book
Ch. 11.1 - What is a portfolio weight?Ch. 11.1 - How do we calculate the return on a portfolio?Ch. 11.2 - What does the correlation measure?Ch. 11.2 - How does the correlation between the stocks in a...Ch. 11.3 - Prob. 1CCCh. 11.3 - Prob. 2CCCh. 11.4 - Prob. 1CCCh. 11.4 - Prob. 2CCCh. 11.4 - Prob. 3CCCh. 11.5 - What do we know about the Sharpe ratio of the...
Ch. 11.5 - If investors are holding optimal portfolios, how...Ch. 11.6 - When will a new investment improve the Sharpe...Ch. 11.6 - Prob. 2CCCh. 11.7 - Prob. 1CCCh. 11.7 - Prob. 2CCCh. 11.8 - Prob. 1CCCh. 11.8 - According to the CAPM, how can we determine a...Ch. 11 - You are considering how to invest part of your...Ch. 11 - You own three stocks: 600 shares of Apple...Ch. 11 - Consider a world that only consists of the three...Ch. 11 - There are two ways to calculate the expected...Ch. 11 - Using the data in the following table, estimate...Ch. 11 - Use the data in Problem 5, consider a portfolio...Ch. 11 - Using your estimates from Problem 5, calculate the...Ch. 11 - Prob. 8PCh. 11 - Suppose two stocks have a correlation of 1. If the...Ch. 11 - Arbor Systems and Gencore stocks both have a...Ch. 11 - Prob. 11PCh. 11 - Suppose Avon and Nova stocks have volatilities of...Ch. 11 - Prob. 13PCh. 11 - Prob. 14PCh. 11 - Prob. 16PCh. 11 - What is the volatility (standard deviation) of an...Ch. 11 - Prob. 18PCh. 11 - Prob. 19PCh. 11 - Prob. 20PCh. 11 - Suppose Ford Motor stock has an expected return of...Ch. 11 - Prob. 22PCh. 11 - Prob. 23PCh. 11 - Prob. 24PCh. 11 - Prob. 25PCh. 11 - Prob. 26PCh. 11 - A hedge fund has created a portfolio using just...Ch. 11 - Consider the portfolio in Problem 27. Suppose the...Ch. 11 - Prob. 29PCh. 11 - Prob. 30PCh. 11 - You have 10,000 to invest. You decide to invest...Ch. 11 - Prob. 32PCh. 11 - Prob. 33PCh. 11 - Prob. 34PCh. 11 - Prob. 35PCh. 11 - Prob. 36PCh. 11 - Assume all investors want to hold a portfolio...Ch. 11 - In addition to risk-free securities, you are...Ch. 11 - You have noticed a market investment opportunity...Ch. 11 - Prob. 40PCh. 11 - When the CAPM correctly prices risk, the market...Ch. 11 - Prob. 45PCh. 11 - Your investment portfolio consists of 15,000...Ch. 11 - Suppose you group all the stocks in the world into...Ch. 11 - Prob. 48PCh. 11 - Consider a portfolio consisting of the following...Ch. 11 - Prob. 50PCh. 11 - What is the risk premium of a zero-beta stock?...
Additional Business Textbook Solutions
Find more solutions based on key concepts
Real options and its types. Introduction: The net present value is the variation between present cash inflows v...
Principles of Managerial Finance (14th Edition) (Pearson Series in Finance)
CHAPTER CASE
S&S Air’s Mortgage
Mark Sexton and Todd Story, the owners of S&S Air, Inc., were impressed by the ...
Essentials of Corporate Finance
(Interest rate determination) You’re looking at some corporate bonds issued by Ford, and you are trying to det...
Foundations of Finance (9th Edition) (Pearson Series in Finance)
Opportunity cost of capital Which of the following statements are true? The opportunity cost of capital:
Equals...
PRIN.OF CORPORATE FINANCE
The value of the shareholders equity account of a firm. Introduction: Shareholders’ equity refers to the residu...
Corporate Finance (The Mcgraw-hill/Irwin Series in Finance, Insurance, and Real Estate)
Risk Premiums and Discount Rates. Top hedge fund manager Sally Buffit believes that a stock with the same marke...
Fundamentals of Corporate Finance (Mcgraw-hill/Irwin Series in Finance, Insurance, and Real Estate)
Knowledge Booster


Learn more about
Need a deep-dive on the concept behind this application? Look no further. Learn more about this topic, finance and related others by exploring similar questions and additional content below.Similar questions
- Calculate the Holding Period Return (HPR) for the portfolio of the three stocks mentioned in Table 1. Calculate the Holding Period Return (HPR) for each of the stock A, B, and C individually given in Table 1. C. Based upon your calculations, evaluate the Holding Period Return (HPR) to exhibit what change in wealth has taken place?arrow_forwardConsider the three stocks in the following table. Pt represents price at time t, and Qt represents shares outstanding at time t. Stock C splits two for one in the last period. a. A market-value-weighted index. rate of returnb. An equally weighted index. rate of returnarrow_forwardSuppose you invest $100, $410, and $640 of your wealth into a stock, the market, and a risk - free asset, respectively. The beta of the stock is 1.3. What is the beta of the portfolio? Enter your answer rounded to 3 DECIMAL PLACES. Enter your response below.arrow_forward
- For the next question, consider the two stocks, A and B, in the following table. Pt represents price at time t, and Qt represents shares outstanding at time t. P0 Q0 P1 Q1 A 50 100 45 100 B 30 200 34 200 Calculate the rate of return on a price-weighted index of the two stocks for between t = 0 and t = 1. Assume the divisor value is 2. Enter your answer as a decimal, rounded to four decimal places (e.g, 0.0123).arrow_forwardConsider the below graph: E(R₁) E(RM) R₁ stocks M O stocks O What is the slope of the graph? If the historical return of an individual stock is lying the slope then the stock is undervalued or overvalued?arrow_forwardGiven the following information on five stocks, construct: a. A simple price-weighted average b. A value-weighted average c. A geometric average d. What is the percentage increase in each average if the stock prices change to those in Column I? e. What is the percentage increase in each average if the stock prices change from those in the Price column to those in Column II? f. Why were the percentage changes different in parts (d) and (e)? g. If you were managing a fund and wanted a source to compare your results to, which of the three averages would you prefer to use, and why? Stock Price # of Shares I II A B C D E F $12.00 150,000 $14.00 125,000 $11.00 200,000 $ 22.00 80,000 $8.00 30,000 $29.00 140,000 $12.00 $12.00 $14.00 $14.00 $20.00 $11.00 $ 22,00 $ 22.00 $8.00 $15.00 $29.00 $29.00arrow_forward
- 1. (a) What are the two components of most stocks’ expected total return?(b) How does one calculate the capital gains yield and the dividend yield of a stock?(c) If D1 = RM3.00, P0 = RM50, and the expected P at t=1 is equal to RM52, what are the stock’s expected dividend yield, capital gains yield, and total return for the coming year?2. (a) Are stock prices affected more by long-term or short-term performance? Explain.(b) A stock is expected to pay a dividend of RM2 at the end of the year. The required rate of return is rs = 12%. What would the stock’s price be if the growth rate were 4%?What would the stock’s price be if the growth rate were 0%?3. If D0 = RM4.00, rs = 9%, and g = 5% for a constant growth stock, what are the stock’s expected dividend yield and capital gains yield for the coming year?4. (a) Explain what is meant by the terms “horizon (terminal) date” and “horizon (terminal) value”.(b)Suppose D0 = RM5.00 and rs = 10%. The expected growth rate from Year 0 to Year 1 (g0…arrow_forwardConsider information given in the table below and answers the question asked thereafter: State Probability return on stock A Return on stock B A 0.15 10% 9% B 0.15 6% 15% C 0.10 20% 10% D 0.18 5% -8% E 0.12 -10% 20% F 0.30 8% 5% i. Calculate expected return on each stock? On the basis of this measure, which stockyou will choose?ii. Calculate standard deviation of the returns on each stock? On the basis of thismeasure, which stock you will choose?iii. Calculate coefficient of variance of the returns on each stock? On the basis of thismeasure, which stock you will choose?arrow_forwardConsider the following two scenarios for the economy and the expected returns in each scenario for the market portfolio, an aggressive stock A, and a defensive stock D. a. Find the beta of each stock. (Round your answers to 2 decimal places.) Stock A Stock D b. If each scenario is equally likely, find the expected rate of return on the market portfolio and on each stock. (Enter your answers as a whole percent.) Market Portfolio % Stock A % Stock D % c. If the T-bill rate is 5%, what does the CAPM say about the fair expected rate of return on the two stocks? (Do not round intermediate calculations. Enter your answers as a percent rounded to 2 decimal places.) Stock A Stock D d. Which stock seems to be a better buy on the basis of your answers to (a) through (c)?arrow_forward
- Under which of the following circumstances would you want to buy a stock? Select one: a. The HPR is greater than zero. b. A stock's holding period return is greater than the CAPM return c. A stock's CAPM return is greater than its holding period return d. The stock's price is higher than its valuearrow_forward. Assume an investor uses the constant-growth DVM to value a stock. Listed are various situations that could affect the computed value of a stock. Look at each one of these individually and indicate whether it would cause the computed value of a stock to go up, go down, or stay the same. Briefly explain your answers. Dividend payout ratio goes up. Stock’s beta rises. Market return increases.arrow_forwardThe following table represents the rate of returns of two stocks in different economic conditions along with their probabilities (the data are also uploaded on moodle) RATES OF RETURN ON STOCKS EXPECTED ECONOMIC PROBABILITY STOCK A STOCK B CONDITIONS RECESSION 0.55 -0.04 -0.02 STABLE 0.35 0.25 0.30 EXPANDING 0.10 0.15 0.20 Answer the following by using mathematical calculations: a) Calculate the expected rate of return for each stock respectively. Explain what the expected value implies. b) Calculate the standard deviation for each stock respectively. Explain what the standard deviation implies. c) If you were an investor in which stock you were going to invest? Justify your answer. d) Calculate the covariance between Stock A and stock B. Discuss. e) Calculate the expected return and the standard deviation of the portfolio consisting 40% in stock A and 60% in stock B. f) Discuss the risk and return associated with investing i All of your funds in stock A ii. All of your funds in stock…arrow_forward
arrow_back_ios
SEE MORE QUESTIONS
arrow_forward_ios
Recommended textbooks for you

Portfolio return, variance, standard deviation; Author: MyFinanceTeacher;https://www.youtube.com/watch?v=RWT0kx36vZE;License: Standard YouTube License, CC-BY