Concept explainers
(a)
To create: The box and whisker plot and then describe the shape of the distribution.
(a)
Answer to Problem 2PT
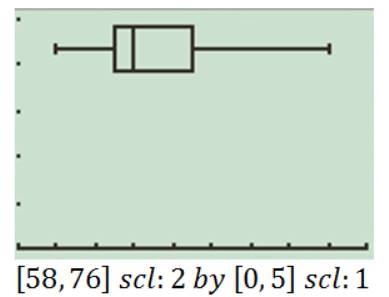
The box and whisker plot is shown in figure (1) and the distribution is “Positively skewed.”
Explanation of Solution
Given:
Consider the given table.
Calculation:
The box and whisker plot can be drawn by using graphing utility as follows.

Figure (1)
The right whisker is longer than the left whisker so the distribution is “Positively skewed.”
Therefore, the box and whisker plot is shown in figure (1) and the distribution is “Positively skewed.”
(b)
To describe: The center and spread of the data using either mean and standard deviation or the five number summary.
(b)
Answer to Problem 2PT
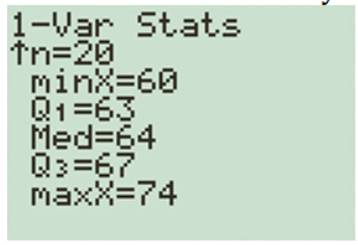
The range is from 60 inches to 74 inches. The median is 64 inches and half of the data are between 63 inches and 67 inches.
Explanation of Solution
Given:
Consider the given table.
Calculation:
Since the distribution is skewed, use the five number summary as follows.

The range is from 60 inches to 74 inches. The median is 64 inches and half of the data are between 63 inches and 67 inches.
Chapter 11 Solutions
Glencoe Algebra 2 Student Edition C2014
Additional Math Textbook Solutions
Elementary Statistics (13th Edition)
Basic Business Statistics, Student Value Edition
Elementary Statistics: Picturing the World (7th Edition)
University Calculus: Early Transcendentals (4th Edition)
Calculus: Early Transcendentals (2nd Edition)
- Can you help me solve this?arrow_forwardName Assume there is the following simplified grade book: Homework Labs | Final Exam | Project Avery 95 98 90 100 Blake 90 96 Carlos 83 79 Dax 55 30 228 92 95 79 90 65 60 Assume that the weights used to compute the final grades are homework 0.3, labs 0.2, the final 0.35, and the project 0.15. | Write an explicit formula to compute Avery's final grade using a single inner product. Write an explicit formula to compute everyone's final grade simultane- ously using a single matrix-vector product.arrow_forward1. Explicitly compute by hand (with work shown) the following Frobenius inner products 00 4.56 3.12 (a) ((º º º). (156 (b) 10.9 -1 0 2)), Fro 5')) Froarrow_forward
- 3. Let 4 0 0 00 0 0 1.2 0 00 0 0 0 -10.1 0 0 0 D = 0 0 0 00 0 0 0 0 05 0 0 0 0 0 0 2.8 Either explicitly compute D-¹ or explain why it doesn't exist.arrow_forward4. [9 points] Assume that B, C, E are all 3 x 3 matrices such that BC == -64 -1 0 3 4 4 4 -2 2 CB=-1-2 4 BE -2 1 3 EC = 1 3 2 -7, 1 6 -6 2-5 -7 -2 Explicitly compute the following by hand. (I.e., write out the entries of the 3 × 3 matrix.) (a) [3 points] B(E+C) (b) [3 points] (E+B)C (c) [3 points] ETBTarrow_forward6. Consider the matrices G = 0 (3) -3\ -3 2 and H = -1 2 0 5 0 5 5 noting that H(:, 3) = 2H(:,1) + H(:, 2). Is G invertible? Explain your answer. Is H invertible? Explain your answer. Use co-factor expansion to find the determinant of H. (Hint: expand the 2nd or 3rd row)arrow_forward
- For the matrix A = = ( 6 }) . explicitly compute by hand (with work shown) the following. I2A, where I2 is the 2 × 2 identity matrix. A-1 solving the following linear systems by using A-¹: c+y= 1 y = 1 (d) (e) (f) A² find the diagonal entries of Aarrow_forwardIf 3x−y=12, what is the value of 8x / 2y A) 212B) 44C) 82D) The value cannot be determined from the information given.arrow_forwardC=59(F−32) The equation above shows how temperature F, measured in degrees Fahrenheit, relates to a temperature C, measured in degrees Celsius. Based on the equation, which of the following must be true? A temperature increase of 1 degree Fahrenheit is equivalent to a temperature increase of 59 degree Celsius. A temperature increase of 1 degree Celsius is equivalent to a temperature increase of 1.8 degrees Fahrenheit. A temperature increase of 59 degree Fahrenheit is equivalent to a temperature increase of 1 degree Celsius. A) I onlyB) II onlyC) III onlyD) I and II onlyarrow_forward
- (1) Let F be a field, show that the vector space F,NEZ* be a finite dimension. (2) Let P2(x) be the vector space of polynomial of degree equal or less than two and M={a+bx+cx²/a,b,cЄ R,a+b=c),show that whether Mis hyperspace or not. (3) Let A and B be a subset of a vector space such that ACB, show that whether: (a) if A is convex then B is convex or not. (b) if B is convex then A is convex or not. (4) Let R be a field of real numbers and X=R, X is a vector space over R show that by definition the norms/II.II, and II.112 on X are equivalent where Ilxll₁ = max(lx,l, i=1,2,...,n) and llxll₂=(x²). oper (5) Let Ⓡ be a field of real numbers, Ⓡis a normed space under usual operations and norm, let E=(2,5,8), find int(E), b(E) and D(E). (6) Write the definition of bounded linear function between two normed spaces and write with prove the relation between continuous and bounded linear function between two normed spaces.arrow_forwardind → 6 Q₁/(a) Let R be a field of real numbers and X-P(x)=(a+bx+cx²+dx/ a,b,c,dER},X is a vector space over R, show that is finite dimension. (b) Let be a bijective linear function from a finite dimension vector ✓ into a space Yand Sbe a basis for X, show that whether f(S) basis for or not. (c) Let be a vector space over a field F and A,B)affine subsets of X,show that whether aAn BB, aAU BB be affine subsets of X or not, a,ẞ EF. (12 Jal (answer only two) (6) Let M be a non-empty subset of a vector space X and tEX, show that M is a hyperspace of X iff t+M is a hyperplane of X and tЄt+M. (b) State Jahn-Banach theorem and write with prove an application of Hahn-arrow_forward(b) Let A and B be two subset of a linear space X such that ACB, show that whether if A is affine set then B affine or need not and if B affine set then A affine set or need not. Qz/antonly be a-Show that every hyperspace of a vecor space X is hyperplane but the convers need not to be true. b- Let M be a finite dimension subspace of a Banach space X show that M is closed set. c-Show that every two norms on finite dimension vector space are equivant (1) Q/answer only two a-Write the definition of bounded set in: a normed space and write with prove an equivalent statement to a definition. b- Let f be a function from a normed space X into a normed space Y, show that f continuous iff f is bounded. c-Show that every finite dimension normed space is a Banach. Q/a- Let A and B two open sets in a normed space X, show that by definition AnB and AUB are open sets. (1 nood truearrow_forward
 Algebra and Trigonometry (6th Edition)AlgebraISBN:9780134463216Author:Robert F. BlitzerPublisher:PEARSON
 Contemporary Abstract AlgebraAlgebraISBN:9781305657960Author:Joseph GallianPublisher:Cengage Learning
 Linear Algebra: A Modern IntroductionAlgebraISBN:9781285463247Author:David PoolePublisher:Cengage Learning
 Algebra And Trigonometry (11th Edition)AlgebraISBN:9780135163078Author:Michael SullivanPublisher:PEARSON
 Introduction to Linear Algebra, Fifth EditionAlgebraISBN:9780980232776Author:Gilbert StrangPublisher:Wellesley-Cambridge Press
 College Algebra (Collegiate Math)AlgebraISBN:9780077836344Author:Julie Miller, Donna GerkenPublisher:McGraw-Hill Education


