
Videos
Portfolio Returns and Deviations Consider the following information about throe stocks:
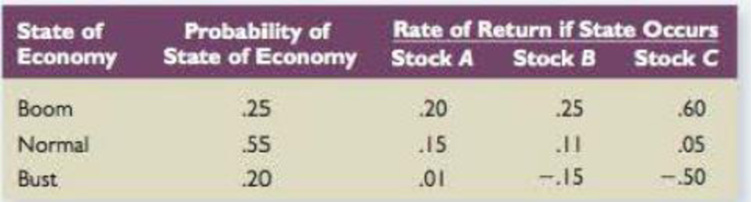
- a. If your portfolio is invested 40 percent each in A and B and 20 percent in C, what is the portfolio expected return? The variance? The standard deviation?
- b. If the expected T-bill rate is 3.80 percent, what is the expected risk premium on the portfolio?
- c. If the expected inflation rate is 3.50 percent, what are the approximate and exact expected real returns on the portfolio? What are the approximate and exact expected real risk premiums on the portfolio?
a.
To determine: The Expected Return, Variance and Standard Deviation.
Introduction: Expected Return is a process of estimating the profits and losses an investor earns through the expected rate of returns. Standard deviation is apportioned of distribution of a collection of figures from its mean.
Answer to Problem 22QP
The Expected Return is 10.65%, Variance is 0.02317 and Standard Deviation is 15.22%.
Explanation of Solution
Determine the Portfolio Return for each Stock
Therefore the Portfolio Return for Boom is 30%, Normal is 11.40%, and Bust is -15.60%.
Determine the Expected Return
Therefore the Expected Return on Portfolio is 11.17%.
Determine the Variance
Therefore the Variance on Portfolio is 0.02317.
Determine the Standard Deviation
Therefore the Standard Deviation on Portfolio is 15.22%.
b.
To determine: The Expected Risk Premium on Portfolio.
Introduction: Expected Return is a process of estimating the profits and losses an investor earns through the expected rate of returns. Standard deviation is apportioned of distribution of a collection of figures from its mean.
Answer to Problem 22QP
The Expected Risk Premium on Portfolio is 6.85%.
Explanation of Solution
Determine the Expected Risk Premium on Portfolio
Therefore the Expected Risk Premium on Portfolio is 6.85%.
c)
To determine: The Approximate and Exact Expected Real Returns and Approximate and Exact Expected Real Risk Premium on Portfolio.
Answer to Problem 22QP
The Approximate Real Returns is 7.15% and Exact Expected Real Returns is 6.91% and Approximate Real Risk Premium is 6.85% and Exact Expected Real Risk Premium is 6.62%.
Explanation of Solution
Determine the Approximate Expected Real Returns
Therefore the Approximate Expected Real Returns is 7.15%.
Determine the Exact Expected Real Returns
Using Fisher equation we calculate the exact expected real returns as,
Therefore the Exact Expected Real Returns is 6.91%.
Determine the Approximate Real Risk-free Rate
Therefore the Exact Expected Real Returns is 0.30%
Determine the Exact Real Risk-free Rate
Using Fisher equation we calculate the exact expected real returns as,
Therefore the Exact Real Risk-free Rate is 0.29%
Determine the Approximate Real Risk Premium
Therefore the Approximate Real Risk Premium is 6.85%
Determine the Exact Real Risk Premium
Therefore the Exact Real Risk Premium is 6.62%.
Want to see more full solutions like this?
Chapter 11 Solutions
UPENN: LOOSE LEAF CORP.FIN W/CONNECT


- You have observed the following returns over time: Assume that the risk-free rate is 6% and the market risk premium is 5%. What are the betas of Stocks X and Y? What are the required rates of return on Stocks X and Y? What is the required rate of return on a portfolio consisting of 80% of Stock X and 20% of Stock Y?arrow_forwardThe market and Stock J have the following probability distributions: a. Calculate the expected rates of return for the market and Stock J. b. Calculate the standard deviations for the market and Stock J.arrow_forwarda. Based on the following information, calculate the expected return and standard deviation for each of the following stocks. What are the covariance and correlation between the returns of the two stocks? Calculate the portfolio returm and portfolio standard deviation if you invest equally in each asset. Returns State of Economy Prob J K Recession 0.25 -0.02 0.034 Normal 0.6 0.138 0.062 Boom 0.15 0.218 0.092 b. A portfolio that combines the risk-free asset and the market portfolio has an expected return of percent and a standard deviation of 10 percent. The risk-free rate is 4 percent, and the Page 7 of 33 expected return on the market portfolio is 12 percent. Assume the capital asset pricing model holds. What expected rate of return would a security earn if it had a 45 corelation with the market portfolio and a standard deviation of 55 percent? C. Suppose the risk-free rate is 4.2 percent and the market portfolıo has an expected return of 10.9 mercent Tibemadkat normfeliobasiabiamance…arrow_forward
- Based on the following information, calculate the expected return and standard deviation for each of the following stocks. What are the covariance and correlation between the returns of the two stocks? Calculate the portfolio return and portfolio standard deviation if you invest equally in each asset. Returns State of Economy Prob J K Recession 0.25 -0.02 0.034 Normal 0.6 0.138 0.062 Boom 0.15 0.218 0.092arrow_forwardAssume the risk-free rate is r = 3%. Consider the data below:Stock(stock 1, stock 2)Expected Return(15%,7%)Volatility(40%,30%)a) Find the What the minimum variance portfolio when ρ12 = 0? and then computeits expected return and volatility?b) Find the minimum variance portfolio when ρ12= =0.4? and then compute itsexpected return and volatility?c) Determine the tangent portfolios & their respective mean returns and volatilities.arrow_forwardSuppose that the risk-free rate r, = 0.03, the expected market return uM = 0.11, and the market volatility oM = 0.16. Stock A has beta = 1.2 and diversifiable risk o̟ = 0.08. Stock B has beta = 0.8 and 0, = 0.03. Stock C has beta = 1.5 and o̟ = 0.1. Consider a portfolio P which is 45% in Stock A, 25% in Stock B, and 30% in Stock C. (a) Find the value of beta for this portfolio. (b) Assuming CAPM, find the portfolio's expected return µp. (c) Find the standard deviation of the portfolio's systematic (or mar- ket) risk. (d) Find the standard deviation o, of the diversifiable risk of P. (You may assume that the diversifiable risks of A,B, and C are uncorrelated.)arrow_forward
- Consider the following probability distribution for stocks C and D: State Probability Return on Stock C Return on Stock D 1 0.30 7 % − 9 % 2 0.50 11 % 14 % 3 0.20 − 16 % 26 % If you invest 25% of your money in C and 75% in D, what would be your portfolio's expected rate of return and standard deviation?arrow_forwardSuppose the expected return for the market portfolio and risk-free rate are 13 percent and 3 percent respectively. Stocks A, B, and C have Treynor measures of 0.24, 0.16, and 0.11, respectively. Based on this information, an investor should ______?arrow_forwardConsider a portfolio consisting of the following three stocks: E The volatility of the market portfolio is 10% and it has an expected return of 8%. The risk-free rate is 3%. a. Compute the beta and expected return of each stock. b. Using your answer from part (a), calculate the expected return of the portfolio. c. What is the beta of the portfolio? d. Using your answer from part (c), calculate the expected return of the portfolio and verify that it matches your answer to part (b). a. Compute the beta and expected return of each stock. (Round to two decimal places.) TITLT Data table Portfolio Weight (A) Volatility (B) Correlation (C) Expected Return (E) % Beta (D) НЕС Согр 0.28 13% 0.33 Green Widget (Click on the following icon a in order to copy its contents into a spreadsheet.) 0.39 27% 0.61 % Portfolio Weight Alive And Well 0.33 14% 0.43 Volatility 13% Correlation with the Market Portfolio НЕС Согр Green Widget 0.28 0.33 b. Using your answer from part (a), calculate the expected…arrow_forward
- Consider the following information on a portfolio of three stocks: State of Economy Probability of State of Economy Stock A Rate of Return Stock B Rate of Return Stock C Rate of Return Boom .25 .04 .33 .55 Normal .60 .09 .13 .19 Bust .15 .15 −.14 −.28 If your portfolio is invested 40 percent each in A and B and 20 percent in C, what is the portfolio’s expected return? The variance? The standard deviation? Note: Do not round intermediate calculations. Round your variance answer to 5 decimal places, e.g., .16161. Enter your other answers as a percent rounded to 2 decimal places, e.g., 32.16. If the expected T-bill rate is 3.4 percent, what is the expected risk premium on the portfolio? Note: Do not round intermediate calculations and enter your answer as a percent rounded to 2 decimal places, e.g., 32.16.arrow_forwardAn investiment portfolio consists of two securities, X and Y. The weight of X is 30%. Asset X's expected return is 15% and the standard deviation is 28%. Asset Y's expected return is 23% and the standard deviation is 33%. Assume the correlation coefficient between X and Y is 0.37. A. Calcualte the expected return of the portfolio. B. Calculate the standard deviation of the portfolio return. C. Suppose now the investor decides to add some risk free assets into this portfolio. The new weights of X, Y and risk free assets are 0.21, 0.49 and 0.30. What is the standard deviation of the new portfolio?arrow_forwardYou are given the following information concerning three portfolios, the market portfolio, and the risk-free asset: Portfolio Y Z Market Risk-free Rp 16.00% бр 32.00% 15.00 27.00 7.30 17.00 11.30 5.80 22.00 0 Bp 1.90 1.25 0.75 1.00 0 Assume that the tracking error of Portfolio X is 13.40 percent. What is the information ratio for Portfolio X? Note: A negative value should be indicated by a minus sign. Do not round intermediate calculations. Round your answer to 4 decimal places. Information ratioarrow_forward
 EBK CONTEMPORARY FINANCIAL MANAGEMENTFinanceISBN:9781337514835Author:MOYERPublisher:CENGAGE LEARNING - CONSIGNMENT

 Intermediate Financial Management (MindTap Course...FinanceISBN:9781337395083Author:Eugene F. Brigham, Phillip R. DavesPublisher:Cengage Learning