
Concept explainers
Videos
SAT Scores by Income The following graph shown U.S. math SAT scores as a function of parents’ income level.81
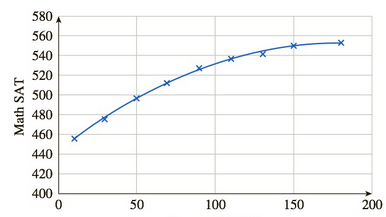
Income ($1,000).
The regression curve shown is given by
Want to see the full answer?
Check out a sample textbook solution
Chapter 10 Solutions
Finite Mathematics and Applied Calculus (MindTap Course List)


 Calculus For The Life SciencesCalculusISBN:9780321964038Author:GREENWELL, Raymond N., RITCHEY, Nathan P., Lial, Margaret L.Publisher:Pearson Addison Wesley,
 Algebra & Trigonometry with Analytic GeometryAlgebraISBN:9781133382119Author:SwokowskiPublisher:Cengage
 College AlgebraAlgebraISBN:9781305115545Author:James Stewart, Lothar Redlin, Saleem WatsonPublisher:Cengage Learning
 Algebra and Trigonometry (MindTap Course List)AlgebraISBN:9781305071742Author:James Stewart, Lothar Redlin, Saleem WatsonPublisher:Cengage Learning