
Finite Mathematics and Applied Calculus (MindTap Course List)
7th Edition
ISBN: 9781337274203
Author: Stefan Waner, Steven Costenoble
Publisher: Cengage Learning
expand_more
expand_more
format_list_bulleted
Concept explainers
Videos
Textbook Question
Chapter 10.4, Problem 36E
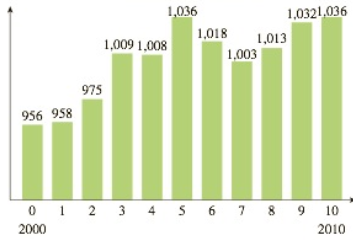
College Basketball: Women The following chart shows the number of NCAA women’s college basketball teams in the United States during the period 2000–2010:43
Men’s basketball teams
Year (t)
a. On average, how fast was the number of women’s college basketball teams growing over the 4-year period beginning in 2004?
b. By inspecting the graph, find the 3-year period over which the average rate of change was largest.
Expert Solution & Answer
Want to see the full answer?
Check out a sample textbook solution
Students have asked these similar questions
2.62 For the period 2001–2008, the Bristol-Myers Squibb Company, Inc. reported the following amounts (in billions of dollars) for (1) net sales and (2) advertising and product promotion. The data are also in the file XR02062.
Source: Bristol-Myers Squibb Company, Annual Reports, 2005, 2008.
Year Net Sales Advertising/Promotion
2001 $16.612 $1.201
2002 16.208 1.143
2003 18.653 1.416
2004 19.380 1.411
2005 19.207 1.476
2006 16.208 1.304
2007 18.193 1.415
2008 20.597 1.550
For these data, construct a line graph that shows both net sales and expenditures for advertising/product promotion over time. Some would suggest that increases in advertising should be accompanied by increases in sales. Does your line graph support this?
The revenue for Google for the years 2010–2014 is shown in the following table (Wallstreet Journal, August 2014). Deflate the revenue in dollars based on the CPI (1982–1984base period). Comment on the company’s revenue in deflated dollars.
Year Revenue ($ billions) CPI2010 29.3 218.12011 37.9 224.92012 50.2 229.62013 59.8 233.02014 66.7 236.7
The following chart shows "living wage" jobs in Rochester per 1000 working age adults over a 5 year period.
Year 2016 2017 2018 2019 2020
Jobs
625 690
740 775
795
What is the average rate of change in the number of living wage jobs from 2016 to 2018?
Jobs/Year
What is the average rate of change in the number of living wage jobs from 2018 to 2020?
Jobs/Year
Chapter 10 Solutions
Finite Mathematics and Applied Calculus (MindTap Course List)
Ch. 10.1 - In Exercises 14, use the given table of values to...Ch. 10.1 - In Exercises 14, use the given table of values to...Ch. 10.1 - In Exercises 14, use the given table of values to...Ch. 10.1 - In Exercises 14, use the given table of values to...Ch. 10.1 - In Exercises 534, estimate the given limit...Ch. 10.1 - In Exercises 534, estimate the given limit...Ch. 10.1 - In Exercises 534, estimate the given limit...Ch. 10.1 - In Exercises 534, estimate the given limit...Ch. 10.1 - Prob. 9ECh. 10.1 - In Exercises 534, estimate the given limit...
Ch. 10.1 - Prob. 11ECh. 10.1 - In Exercises 534, estimate the given limit...Ch. 10.1 - In Exercises 534, estimate the given limit...Ch. 10.1 - Prob. 14ECh. 10.1 - In Exercises 534, estimate the given limit...Ch. 10.1 - In Exercises 534, estimate the given limit...Ch. 10.1 - Prob. 17ECh. 10.1 - Prob. 18ECh. 10.1 - Prob. 19ECh. 10.1 - Prob. 20ECh. 10.1 - In Exercises 534, estimate the given limit...Ch. 10.1 - In Exercises 534, estimate the given limit...Ch. 10.1 - In Exercises 534, estimate the given limit...Ch. 10.1 - Prob. 24ECh. 10.1 - In Exercises 534, estimate the given limit...Ch. 10.1 - In Exercises 534, estimate the given limit...Ch. 10.1 - In Exercises 534, estimate the given limit...Ch. 10.1 - In Exercises 534, estimate the given limit...Ch. 10.1 - Prob. 29ECh. 10.1 - In Exercises 534, estimate the given limit...Ch. 10.1 - In Exercises 534, estimate the given limit...Ch. 10.1 - Prob. 32ECh. 10.1 - Prob. 33ECh. 10.1 - Prob. 34ECh. 10.1 - Prob. 35ECh. 10.1 - Prob. 36ECh. 10.1 - Prob. 37ECh. 10.1 - Prob. 38ECh. 10.1 - In Exercises 3548 the graph of f is given. Use the...Ch. 10.1 - In Exercises 3548 the graph of f is given. Use the...Ch. 10.1 - In Exercises 3548 the graph of f is given. Use the...Ch. 10.1 - Prob. 42ECh. 10.1 - Prob. 43ECh. 10.1 - Prob. 44ECh. 10.1 - In Exercises 3548 the graph of f is given. Use the...Ch. 10.1 - In Exercises 3548 the graph of f is given. Use the...Ch. 10.1 - In Exercises 3548 the graph of f is given. Use the...Ch. 10.1 - In Exercises 3548 the graph of f is given. Use the...Ch. 10.1 - Doctorates in Mexico The annual number of PhD...Ch. 10.1 - Housing Starts The number s(t) ofhousing starts...Ch. 10.1 - Funding for NASA up to 1966 The percentage of the...Ch. 10.1 - Funding for NASA up to 1966 (Compare Exercise 51.)...Ch. 10.1 - Scientific Research: 19832003 The number of...Ch. 10.1 - Scientific Research: 19832003 The percentage of...Ch. 10.1 - SAT Scores by Income The following bar graph shows...Ch. 10.1 - SAT Scores by Income The following bar graph shows...Ch. 10.1 - Flash Crash The graph shows a rough representation...Ch. 10.1 - Flash Crash The graph shows a rough representation...Ch. 10.1 - Home Prices The following graph shows the values...Ch. 10.1 - Home Prices: Optimist Projection The following...Ch. 10.1 - Prob. 61ECh. 10.1 - Prob. 62ECh. 10.1 - Prob. 63ECh. 10.1 - Prob. 64ECh. 10.1 - Prob. 65ECh. 10.1 - Prob. 66ECh. 10.1 - Prob. 67ECh. 10.1 - Prob. 68ECh. 10.1 - What is wrong with the following statement?...Ch. 10.1 - Prob. 70ECh. 10.1 - Prob. 71ECh. 10.1 - Prob. 72ECh. 10.1 - Prob. 73ECh. 10.1 - Prob. 74ECh. 10.2 - In Exercises 114 the graph of a function f is...Ch. 10.2 - In Exercises 114 the graph of a function f is...Ch. 10.2 - In Exercises 114 the graph of a function f is...Ch. 10.2 - Prob. 4ECh. 10.2 - In Exercises 114 the graph of a function f is...Ch. 10.2 - In Exercises 114 the graph of a function f is...Ch. 10.2 - In Exercises 114 the graph of a function f is...Ch. 10.2 - Prob. 8ECh. 10.2 - Prob. 9ECh. 10.2 - Prob. 10ECh. 10.2 - Prob. 11ECh. 10.2 - Prob. 12ECh. 10.2 - Prob. 13ECh. 10.2 - Prob. 14ECh. 10.2 - In Exercises 15 and 16, identify which (if any) of...Ch. 10.2 - In Exercises 15 and 16, identify which (if any) of...Ch. 10.2 - In Exercises 1724, the graph of a function f is...Ch. 10.2 - In Exercises 1724, the graph of a function f is...Ch. 10.2 - Prob. 19ECh. 10.2 - In Exercises 1724, the graph of a function f is...Ch. 10.2 - In Exercises 1724, the graph of a function f is...Ch. 10.2 - In Exercises 1724, the graph of a function f is...Ch. 10.2 - Prob. 23ECh. 10.2 - In Exercises 1724, the graph of a function f is...Ch. 10.2 - In Exercises 2532, use a graph of f or some other...Ch. 10.2 - In Exercises 2532, use a graph of f or some other...Ch. 10.2 - In Exercises 2532, use a graph of f or some other...Ch. 10.2 - In Exercises 2532, use a graph of f or some other...Ch. 10.2 - In Exercises 2532, use a graph of f or some other...Ch. 10.2 - Prob. 30ECh. 10.2 - In Exercises 2532, use a graph of f or some other...Ch. 10.2 - Prob. 32ECh. 10.2 - In Exercises 3342, use a graph to determine...Ch. 10.2 - In Exercises 3342, use a graph to determine...Ch. 10.2 - Prob. 35ECh. 10.2 - Prob. 36ECh. 10.2 - In Exercises 3342, use a graph to determine...Ch. 10.2 - Prob. 38ECh. 10.2 - In Exercises 3342, use a graph to determine...Ch. 10.2 - Prob. 40ECh. 10.2 - Prob. 41ECh. 10.2 - Prob. 42ECh. 10.2 - Multiple choice: If f is defined on all real...Ch. 10.2 - Prob. 44ECh. 10.2 - Prob. 45ECh. 10.2 - Multiple: choice If f is defined everywhere except...Ch. 10.2 - Prob. 47ECh. 10.2 - Prob. 48ECh. 10.2 - True or false? The graph of a function that is...Ch. 10.2 - Prob. 50ECh. 10.2 - Prob. 51ECh. 10.2 - Prob. 52ECh. 10.2 - Prob. 53ECh. 10.2 - Prob. 54ECh. 10.2 - Prob. 55ECh. 10.2 - Prob. 56ECh. 10.3 - In Exercises 14, complete the given sentence. The...Ch. 10.3 - In Exercises 14, complete the given sentence. The...Ch. 10.3 - Prob. 3ECh. 10.3 - Prob. 4ECh. 10.3 - In Exercises 520, determine whether the given...Ch. 10.3 - In Exercises 520, determine whether the given...Ch. 10.3 - In Exercises 520, determine whether the given...Ch. 10.3 - In Exercises 520, determine whether the given...Ch. 10.3 - In Exercises 520, determine whether the given...Ch. 10.3 - Prob. 10ECh. 10.3 - Prob. 11ECh. 10.3 - Prob. 12ECh. 10.3 - Prob. 13ECh. 10.3 - Prob. 14ECh. 10.3 - Prob. 15ECh. 10.3 - Prob. 16ECh. 10.3 - Prob. 17ECh. 10.3 - Prob. 18ECh. 10.3 - Prob. 19ECh. 10.3 - Prob. 20ECh. 10.3 - Prob. 21ECh. 10.3 - Prob. 22ECh. 10.3 - Prob. 23ECh. 10.3 - In Exercises 21-74, calculate the limit...Ch. 10.3 - In Exercises 21-74, calculate the limit...Ch. 10.3 - Prob. 26ECh. 10.3 - In Exercises 21-74, calculate the limit...Ch. 10.3 - Prob. 28ECh. 10.3 - Prob. 29ECh. 10.3 - Prob. 30ECh. 10.3 - In Exercises 21-74, calculate the limit...Ch. 10.3 - Prob. 32ECh. 10.3 - In Exercises 21-74, calculate the limit...Ch. 10.3 - Prob. 34ECh. 10.3 - Prob. 35ECh. 10.3 - Prob. 36ECh. 10.3 - In Exercises 21-74, calculate the limit...Ch. 10.3 - Prob. 38ECh. 10.3 - Prob. 39ECh. 10.3 - Prob. 40ECh. 10.3 - Prob. 41ECh. 10.3 - Prob. 42ECh. 10.3 - Prob. 43ECh. 10.3 - Prob. 44ECh. 10.3 - Prob. 45ECh. 10.3 - Prob. 46ECh. 10.3 - Prob. 47ECh. 10.3 - Prob. 48ECh. 10.3 - Prob. 49ECh. 10.3 - Prob. 50ECh. 10.3 - Prob. 51ECh. 10.3 - Prob. 52ECh. 10.3 - Prob. 53ECh. 10.3 - Prob. 54ECh. 10.3 - Prob. 55ECh. 10.3 - Prob. 56ECh. 10.3 - In Exercises 21-74, calculate the limit...Ch. 10.3 - Prob. 58ECh. 10.3 - Prob. 59ECh. 10.3 - Prob. 60ECh. 10.3 - In Exercises 21-74, calculate the limit...Ch. 10.3 - Prob. 62ECh. 10.3 - In Exercises 21-74, calculate the limit...Ch. 10.3 - In Exercises 21-74, calculate the limit...Ch. 10.3 - In Exercises 21-74, calculate the limit...Ch. 10.3 - In Exercises 21-74, calculate the limit...Ch. 10.3 - In Exercises 21-74, calculate the limit...Ch. 10.3 - Prob. 68ECh. 10.3 - In Exercises 21-74, calculate the limit...Ch. 10.3 - Prob. 70ECh. 10.3 - In Exercises 21-74, calculate the limit...Ch. 10.3 - Prob. 72ECh. 10.3 - Prob. 73ECh. 10.3 - Prob. 74ECh. 10.3 - In Exercises 75-88, identify all singular points...Ch. 10.3 - Prob. 76ECh. 10.3 - Prob. 77ECh. 10.3 - Prob. 78ECh. 10.3 - Prob. 79ECh. 10.3 - Prob. 80ECh. 10.3 - In Exercises 75-88, identify all singular points...Ch. 10.3 - Prob. 82ECh. 10.3 - In Exercises 75-88, identify all singular points...Ch. 10.3 - Prob. 84ECh. 10.3 - Prob. 85ECh. 10.3 - Prob. 86ECh. 10.3 - Prob. 87ECh. 10.3 - Prob. 88ECh. 10.3 - Prob. 89ECh. 10.3 - Prob. 90ECh. 10.3 - Prob. 91ECh. 10.3 - Movie Advertising The percentage of movie...Ch. 10.3 - Law Enforcement in the 1980s and 1990s The cost of...Ch. 10.3 - Prob. 94ECh. 10.3 - Prob. 95ECh. 10.3 - SAT Scores by Income The following bar graph shows...Ch. 10.3 - Prob. 97ECh. 10.3 - Prob. 98ECh. 10.3 - Prob. 99ECh. 10.3 - Prob. 100ECh. 10.3 - Prob. 101ECh. 10.3 - Prob. 102ECh. 10.3 - Prob. 103ECh. 10.3 - Prob. 104ECh. 10.3 - Why was the following marked wrong? What is the...Ch. 10.3 - Why was the following marked wrong? What is the...Ch. 10.3 - Your friend Karin tells you that f(x)=1/(x2)2...Ch. 10.3 - Prob. 108ECh. 10.3 - Prob. 109ECh. 10.3 - Prob. 110ECh. 10.3 - Prob. 111ECh. 10.3 - Prob. 112ECh. 10.3 - What is wrong with the following statement? If...Ch. 10.3 - What is wrong with the following statement? If...Ch. 10.3 - Prob. 115ECh. 10.3 - Prob. 116ECh. 10.3 - Prob. 117ECh. 10.3 - Prob. 118ECh. 10.4 - In Exercises 118, calculate the average rate of...Ch. 10.4 - In Exercises 118, calculate the average rate of...Ch. 10.4 - In Exercises 118, calculate the average rate of...Ch. 10.4 - In Exercises 118, calculate the average rate of...Ch. 10.4 - In Exercises 118, calculate the average rate of...Ch. 10.4 - In Exercises 118, calculate the average rate of...Ch. 10.4 - In Exercises 118, calculate the average rate of...Ch. 10.4 - In Exercises 118, calculate the average rate of...Ch. 10.4 - In Exercises 118, calculate the average rate of...Ch. 10.4 - In Exercises 118, calculate the average rate of...Ch. 10.4 - In Exercises 118, calculate the average rate of...Ch. 10.4 - In Exercises 118, calculate the average rate of...Ch. 10.4 - In Exercises 118, calculate the average rate of...Ch. 10.4 - In Exercises 118, calculate the average rate of...Ch. 10.4 - In Exercises 118, calculate the average rate of...Ch. 10.4 - In Exercises 118, calculate the average rate of...Ch. 10.4 - In Exercises 118, calculate the average rate of...Ch. 10.4 - In Exercises 118, calculate the average rate of...Ch. 10.4 - In Exercises 1924, calculate the average rate of...Ch. 10.4 - In Exercises 1924, calculate the average rate of...Ch. 10.4 - In Exercises 1924, calculate the average rate of...Ch. 10.4 - Prob. 22ECh. 10.4 - Prob. 23ECh. 10.4 - Prob. 24ECh. 10.4 - World Military Expenditure The following table...Ch. 10.4 - Education Expenditure The following table shows...Ch. 10.4 - Crude Oil Production: Mexico The following table...Ch. 10.4 - Offshore Crude Oil Production: Mexico The...Ch. 10.4 - Subprime Mortgages during the Housing Crisis The...Ch. 10.4 - Subprime Mortgage Debt during the Housing Crisis...Ch. 10.4 - Immigration to Ireland The following graph shows...Ch. 10.4 - Emigration from Ireland The following graph shows...Ch. 10.4 - Science Research in the United States The...Ch. 10.4 - Prob. 34ECh. 10.4 - Prob. 35ECh. 10.4 - College Basketball: Women The following chart...Ch. 10.4 - Funding for the Arts State governments in the...Ch. 10.4 - Funding for the Arts The U.S. federal government...Ch. 10.4 - Market Index Joe Downs runs a small investment...Ch. 10.4 - Prob. 42ECh. 10.4 - Crude Oil Prices The price per barrel of crude oil...Ch. 10.4 - Median Home Prices The median home price in the...Ch. 10.4 - Prob. 45ECh. 10.4 - Prob. 46ECh. 10.4 - The 2003 SARS Outbreak In the early stages of the...Ch. 10.4 - Prob. 48ECh. 10.4 - The 2014 Ebola Outbreak In the first 6 months of...Ch. 10.4 - Prob. 50ECh. 10.4 - Prob. 51ECh. 10.4 - Prob. 52ECh. 10.4 - Prob. 53ECh. 10.4 - Prob. 54ECh. 10.4 - Describe three ways we have used to determine the...Ch. 10.4 - Prob. 56ECh. 10.4 - Prob. 57ECh. 10.4 - Prob. 58ECh. 10.4 - Sketch the graph of a function whose average rate...Ch. 10.4 - Prob. 60ECh. 10.4 - Prob. 61ECh. 10.4 - Prob. 62ECh. 10.4 - Prob. 63ECh. 10.4 - Prob. 64ECh. 10.4 - Prob. 65ECh. 10.4 - Prob. 66ECh. 10.4 - Prob. 67ECh. 10.4 - Prob. 68ECh. 10.5 - In Exercises 14, estimate the derivative from the...Ch. 10.5 - In Exercises 14, estimate the derivative from the...Ch. 10.5 - In Exercises 14, estimate the derivative from the...Ch. 10.5 - Prob. 4ECh. 10.5 - Consider the functions in Exercises 58 as...Ch. 10.5 - Consider the functions in Exercises 58 as...Ch. 10.5 - Prob. 7ECh. 10.5 - Prob. 8ECh. 10.5 - In Exercises 912 the function gives the cost to...Ch. 10.5 - In Exercises 912 the function gives the cost to...Ch. 10.5 - Prob. 11ECh. 10.5 - Prob. 12ECh. 10.5 - In Exercises 1316 the graph of a function is shown...Ch. 10.5 - In Exercises 1316 the graph of a function is shown...Ch. 10.5 - In Exercises 1316 the graph of a function is shown...Ch. 10.5 - Prob. 16ECh. 10.5 - In Exercises 1722, say at which labeled point the...Ch. 10.5 - Prob. 18ECh. 10.5 - Prob. 19ECh. 10.5 - In Exercises 1722, say at which labeled point the...Ch. 10.5 - Prob. 21ECh. 10.5 - Prob. 22ECh. 10.5 - In each of Exercises 2326, three slopes are given....Ch. 10.5 - In each of Exercises 2326, three slopes are given....Ch. 10.5 - Prob. 25ECh. 10.5 - Prob. 26ECh. 10.5 - In Exercises 2730, find the approximate...Ch. 10.5 - Prob. 28ECh. 10.5 - Prob. 29ECh. 10.5 - Prob. 30ECh. 10.5 - Prob. 31ECh. 10.5 - Prob. 32ECh. 10.5 - Prob. 33ECh. 10.5 - Which is correct? The derivative function f(x)...Ch. 10.5 - Let f have the graph shown. a. The average rate of...Ch. 10.5 - Prob. 36ECh. 10.5 - Prob. 37ECh. 10.5 - In Exercises 3740, use a quick approximation to...Ch. 10.5 - In Exercises 3740, use a quick approximation to...Ch. 10.5 - Prob. 40ECh. 10.5 - In Exercises 41-48, estimate the indicated...Ch. 10.5 - Prob. 42ECh. 10.5 - In Exercises 41-48, estimate the indicated...Ch. 10.5 - In Exercises 41-48, estimate the indicated...Ch. 10.5 - Prob. 45ECh. 10.5 - Prob. 46ECh. 10.5 - In Exercises 41-48, estimate the indicated...Ch. 10.5 - Prob. 48ECh. 10.5 - In Exercises 4954, (a) use any method to estimate...Ch. 10.5 - Prob. 50ECh. 10.5 - Prob. 51ECh. 10.5 - Prob. 52ECh. 10.5 - In Exercises 4954, (a) use any method to estimate...Ch. 10.5 - Prob. 54ECh. 10.5 - In Exercises 55-58, estimate the given quantity....Ch. 10.5 - Prob. 56ECh. 10.5 - Prob. 57ECh. 10.5 - Prob. 58ECh. 10.5 - In Exercises 5964, match the graph of f to the...Ch. 10.5 - In Exercises 5964, match the graph of f to the...Ch. 10.5 - In Exercises 5964, match the graph of f to the...Ch. 10.5 - In Exercises 5964, match the graph of f to the...Ch. 10.5 - In Exercises 5964, match the graph of f to the...Ch. 10.5 - In Exercises 5964, match the graph of f to the...Ch. 10.5 - In Exercises 6568 the graph of a function is...Ch. 10.5 - Prob. 66ECh. 10.5 - Prob. 67ECh. 10.5 - Prob. 68ECh. 10.5 - Prob. 69ECh. 10.5 - Prob. 70ECh. 10.5 - In Exercises 6972 the graph of the derivative of a...Ch. 10.5 - Prob. 72ECh. 10.5 - Prob. 73ECh. 10.5 - Prob. 74ECh. 10.5 - Prob. 75ECh. 10.5 - Prob. 76ECh. 10.5 - Temperatures on Mars The air temperature one...Ch. 10.5 - Prob. 78ECh. 10.5 - Demand Suppose the demand for a new brand of...Ch. 10.5 - Demand Suppose the demand for an old brand of TV...Ch. 10.5 - Oil Imports from Mexico The following graph shows...Ch. 10.5 - Oil Production in Mexico The following graph shows...Ch. 10.5 - Prob. 83ECh. 10.5 - Prob. 84ECh. 10.5 - Prob. 85ECh. 10.5 - Prob. 86ECh. 10.5 - Crude Oil Prices The price per barrel of crude oil...Ch. 10.5 - Median Home Prices The median home price in the...Ch. 10.5 - The 2003 SARS Outbreak In the early stages of the...Ch. 10.5 - Prob. 90ECh. 10.5 - Prob. 91ECh. 10.5 - Prob. 92ECh. 10.5 - Prob. 93ECh. 10.5 - Prob. 94ECh. 10.5 - Prob. 95ECh. 10.5 - Prob. 96ECh. 10.5 - Prob. 97ECh. 10.5 - Prob. 98ECh. 10.5 - Prob. 99ECh. 10.5 - Prob. 100ECh. 10.5 - Prob. 101ECh. 10.5 - Prob. 102ECh. 10.5 - Prob. 103ECh. 10.5 - Prob. 104ECh. 10.5 - Prob. 105ECh. 10.5 - Prob. 106ECh. 10.5 - Prob. 107ECh. 10.5 - Prob. 108ECh. 10.5 - Prob. 109ECh. 10.5 - Prob. 110ECh. 10.5 - Prob. 111ECh. 10.5 - Company Cs profits are given by P(0)=1 millionand...Ch. 10.5 - Prob. 113ECh. 10.5 - During the 1-month period starting last January 1,...Ch. 10.5 - If the derivative of f is zero at a point, what do...Ch. 10.5 - Prob. 116ECh. 10.5 - Prob. 117ECh. 10.5 - Prob. 118ECh. 10.5 - Prob. 119ECh. 10.5 - Prob. 120ECh. 10.5 - Prob. 121ECh. 10.5 - Prob. 122ECh. 10.5 - Prob. 123ECh. 10.5 - Prob. 124ECh. 10.5 - Prob. 125ECh. 10.5 - Prob. 126ECh. 10.5 - Prob. 127ECh. 10.5 - Prob. 128ECh. 10.5 - Prob. 129ECh. 10.5 - Prob. 130ECh. 10.6 - In Exercises 1-14, compute f(a) algebraically for...Ch. 10.6 - Prob. 2ECh. 10.6 - In Exercises 1-14, compute f(a) algebraically for...Ch. 10.6 - In Exercises 1-14, compute f(a) algebraically for...Ch. 10.6 - In Exercises 1-14, compute f(a) algebraically for...Ch. 10.6 - Prob. 6ECh. 10.6 - Prob. 7ECh. 10.6 - Prob. 8ECh. 10.6 - Prob. 9ECh. 10.6 - Prob. 10ECh. 10.6 - In Exercises 1-14, compute f(a) algebraically for...Ch. 10.6 - In Exercises 1-14, compute f(a) algebraically for...Ch. 10.6 - In Exercises 1-14, compute f(a) algebraically for...Ch. 10.6 - In Exercises 1-14, compute f(a) algebraically for...Ch. 10.6 - In Exercises 15-28, compute the derivative...Ch. 10.6 - In Exercises 15-28, compute the derivative...Ch. 10.6 - Prob. 17ECh. 10.6 - Prob. 18ECh. 10.6 - Prob. 19ECh. 10.6 - Prob. 20ECh. 10.6 - In Exercises 15-28, compute the derivative...Ch. 10.6 - Prob. 22ECh. 10.6 - Prob. 23ECh. 10.6 - Prob. 24ECh. 10.6 - In Exercises 15-28, compute the derivative...Ch. 10.6 - In Exercises 15-28, compute the derivative...Ch. 10.6 - In Exercises 15-28, compute the derivative...Ch. 10.6 - Prob. 28ECh. 10.6 - Prob. 29ECh. 10.6 - Prob. 30ECh. 10.6 - Prob. 31ECh. 10.6 - Prob. 32ECh. 10.6 - In Exercises 29-38, compute the indicated...Ch. 10.6 - Prob. 34ECh. 10.6 - Prob. 35ECh. 10.6 - Prob. 36ECh. 10.6 - In Exercises 29-38, compute the indicated...Ch. 10.6 - Prob. 38ECh. 10.6 - In Exercises39-44, find the equation of the...Ch. 10.6 - Prob. 40ECh. 10.6 - Prob. 41ECh. 10.6 - Prob. 42ECh. 10.6 - In Exercises39-44, find the equation of the...Ch. 10.6 - Prob. 44ECh. 10.6 - Velocity If a stone is dropped from a height of...Ch. 10.6 - Prob. 46ECh. 10.6 - Oil Imports from Mexico Daily crude oil imports to...Ch. 10.6 - Prob. 48ECh. 10.6 - Bottled Water Sales The following chart shows the...Ch. 10.6 - Bottled Water Sales The following chart shows...Ch. 10.6 - Ecology Increasing numbers of manatees have been...Ch. 10.6 - SAT Scores by Income The following graph shown...Ch. 10.6 - Television Advertising The cost, in thousands of...Ch. 10.6 - Prob. 54ECh. 10.6 - Of the three methods (numerical, graphical, and...Ch. 10.6 - Explain why we cannot put h=0 in the formula...Ch. 10.6 - You just got your derivatives test back, and you...Ch. 10.6 - Your friend just got his derivatives test back and...Ch. 10.6 - Prob. 59ECh. 10.6 - Your third friend just got her derivatives test...Ch. 10.6 - Prob. 61ECh. 10.6 - Prob. 62ECh. 10.6 - Prob. 63ECh. 10.6 - One cannot put h=0 in the formula...Ch. 10 - In Exercise 1-4, numerically estimate whether the...Ch. 10 - In Exercise 1-4, numerically estimate whether the...Ch. 10 - In Exercise 1-4, numerically estimate whether the...Ch. 10 - In Exercise 1-4, numerically estimate whether the...Ch. 10 - In Exercises 5 and 6 the graph of a function f is...Ch. 10 - In Exercises 5 and 6 the graph of a function f is...Ch. 10 - In Exercises 730, calculate the limit...Ch. 10 - In Exercises 730, calculate the limit...Ch. 10 - In Exercises 730, calculate the limit...Ch. 10 - In Exercises 730, calculate the limit...Ch. 10 - In Exercises 730, calculate the limit...Ch. 10 - In Exercises 730, calculate the limit...Ch. 10 - In Exercises 730, calculate the limit...Ch. 10 - In Exercises 730, calculate the limit...Ch. 10 - In Exercises 730, calculate the limit...Ch. 10 - In Exercises 730, calculate the limit...Ch. 10 - In Exercises 730, calculate the limit...Ch. 10 - In Exercises 730, calculate the limit...Ch. 10 - In Exercises 730, calculate the limit...Ch. 10 - In Exercises 730, calculate the limit...Ch. 10 - In Exercises 730, calculate the limit...Ch. 10 - In Exercises 730, calculate the limit...Ch. 10 - Prob. 23RECh. 10 - Prob. 24RECh. 10 - Prob. 25RECh. 10 - Prob. 26RECh. 10 - In Exercises 730, calculate the limit...Ch. 10 - Prob. 28RECh. 10 - Prob. 29RECh. 10 - Prob. 30RECh. 10 - Prob. 31RECh. 10 - Prob. 32RECh. 10 - Prob. 33RECh. 10 - Prob. 34RECh. 10 - Prob. 35RECh. 10 - Prob. 36RECh. 10 - Prob. 37RECh. 10 - Prob. 38RECh. 10 - Prob. 39RECh. 10 - Prob. 40RECh. 10 - In Exercises 4144, use the definition of the...Ch. 10 - Prob. 42RECh. 10 - Prob. 43RECh. 10 - Prob. 44RECh. 10 - Prob. 45RECh. 10 - Prob. 46RECh. 10 - Prob. 47RECh. 10 - Prob. 48RECh. 10 - Prob. 49RECh. 10 - Prob. 50RECh. 10 - Real Estate Marjory Duffin has persuaded John...Ch. 10 - Prob. 52RECh. 10 - Prob. 53RECh. 10 - Rising Sea Level Marjory Duffin recently purchased...Ch. 10 - Prob. 55RECh. 10 - Prob. 56RECh. 10 - Prob. 57RECh. 10 - Prob. 58RECh. 10 - Prob. 1CSCh. 10 - Prob. 2CSCh. 10 - What is the marginal emission charge (derivative...Ch. 10 - We said that the revised policy provided an...Ch. 10 - What change in C(q) wouldmake 8 million tons the...Ch. 10 - If the scenario in Exercise 5 took place, what...Ch. 10 - Because of intense lobbying by the utility...Ch. 10 - Suppose that instead of imposing a fixed charge...
Knowledge Booster


Learn more about
Need a deep-dive on the concept behind this application? Look no further. Learn more about this topic, calculus and related others by exploring similar questions and additional content below.Similar questions
- Using the data in Table 6–11, calculate a 3-month moving average forecast for month 12.arrow_forwardQ1. The table provided gives data on indexes of output per hour (X) and real compensation per hour (Y) for the business and nonfarm business sectors of the U.S. economy for 1960–2005. The base year of the indexes is 1992 = 100 and the indexes are seasonally adjusted. a. Plot Y against X for the two sectors separately. b. What is the economic theory behind the relationship between the two variables? Does the scattergram support the theory? c. Estimate the OLS regression of Y on X. Note: on the table ( 1. Output refers to real gross domestic product in the sector. 2. Wages and salaries of employees plus employers’ contributions for social insurance and private benefit plans. 3. Hourly compensation divided by the consumer price index for all urban consumers for recent quarters.) Thank you!arrow_forwardThe following chart shows "living wage" jobs in Tucson per 1000 working age adults over a 5 year period. Year 2007 2008 2009 2010 2011 Jobs 675 720 760 795 820 What is the average rate of change in the number of living wage jobs from 2007 to 2009? Jobs/Year What is the average rate of change in the number of living wage jobs from 2009 to 2011? Jobs/Yeararrow_forward
- The Internal Revenue Service Restructuring and Reform Act (RRA) was signed into law by President Bill Clinton in 1998. A major objective of the RRA was to promote electronic filing of tax returns. The data in the table that follows show the percentage of individual income tax returns filed electronically for filing years 2000–2008. Since the percentage P of returns filed electronically depends on the filing year y and each input corresponds to exactly one output, the percentage of returns filed electronically is a function of the filing year;so P(y) represents the percentage of returns filed electronically for filing year y. (a) Find the average rate of change of the percentage of e-filed returns from 2000 to 2002. (b) Find the average rate of change of the percentage of e-filed returns from 2004 to 2006. (c) Find the average rate of change of the percentage of e-filed returns from 2006 to 2008. (d) What is happening to the average rate of change as time passes?arrow_forwardThe figure below shows timber production in particular months from 2000 to 2005. Which of the following months of the year seems to have the lowest timber production? (a) January (b) April (c) July (d) Octoberarrow_forwardThe body mass index (BMI) of a person is the person’s weight divided by the square of his or her height. It is an indirect measure of the person’s body fat and an indicator of obesity. Results from surveys conducted by the Centers for Disease Control and Prevention (CDC) showed that the estimated mean BMI for US adults increased from 25.0 in the 1960–1962 period to 28.1 in the 1999–2002 period. [Source: Ogden, C., et al. (2004). Mean body weight, height, and body mass index, United States 1960–2002. Suppose you are a health researcher. You conduct a hypothesis test to determine whether the mean BMI of US adults in the current year is greater than the mean BMI of US adults in 2000. Assume that the mean BMI of US adults in 2000 was 28.1 (the population mean). You obtain a sample of BMI measurements of 1,034 US adults, which yields a sample mean of M = 28.9. Let μ denote the mean BMI of US adults in the current year. Please Formulate the null and alternative hypothesesarrow_forward
arrow_back_ios
arrow_forward_ios
Recommended textbooks for you

Use of ALGEBRA in REAL LIFE; Author: Fast and Easy Maths !;https://www.youtube.com/watch?v=9_PbWFpvkDc;License: Standard YouTube License, CC-BY
Compound Interest Formula Explained, Investment, Monthly & Continuously, Word Problems, Algebra; Author: The Organic Chemistry Tutor;https://www.youtube.com/watch?v=P182Abv3fOk;License: Standard YouTube License, CC-BY
Applications of Algebra (Digit, Age, Work, Clock, Mixture and Rate Problems); Author: EngineerProf PH;https://www.youtube.com/watch?v=Y8aJ_wYCS2g;License: Standard YouTube License, CC-BY