
Videos
Real Estate Marjory Duffin has persuaded John O’Hagan to consider investing a portion of OHaganBooks.com profits in real estate, now that the real estate market seems to have bottomed out. A real-estate broker friend of hers emailed her the following (somewhat optimistic) graph from brokersadvocacy.com:
Home price index
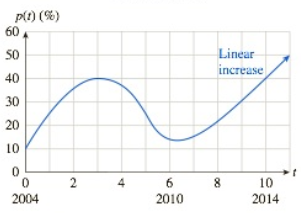
Here,
a. Assuming that the trend shown in the graph continues indefinitely, estimate
b. Estimate
Want to see the full answer?
Check out a sample textbook solution
Chapter 10 Solutions
Finite Mathematics and Applied Calculus (MindTap Course List)
Additional Math Textbook Solutions
Calculus & Its Applications (14th Edition)
Precalculus
Glencoe Math Accelerated, Student Edition
Calculus 2012 Student Edition (by Finney/Demana/Waits/Kennedy)
Calculus: Single And Multivariable


- The analysis of Earnings Per Share (EPS) is as follows: 2015: $5.70 2016: $3.30 2017: $6.21 2018: $6.20 2019: $4.91 a. What is the trend analysis for that EPS and why it is increasing and decreasing?arrow_forward4. Compare the high and the low common stock prices since 2007 in a graph of your choice for "XXX" Corporation. Write a brief interpretation of the main features of the data portrayed in the graph. The high and the low common stock prices for the "XXX" Corporation since 1983 are: Year High Low 2007 40.85 30.90 2008 40.85 30.00 2009 40.85 29.25 2010 48.00 34.00 2011 64.75 32.00 Year High Low 2013 72.00 45.75 2014 81.65 63.25 2015 80.15 63.50 2016 75.35 60.25 2017 98.35 67.75 2018 99.00 70.00 2012 51.75 39.65arrow_forwardConsider this In the News feature and the following graph. 2200- Stte INional 2175 2150- 21.4 uli 2125 21.1 211 2100- 209 208 20.75 205 2050 204 2025 2000- 1975 1950 Composite Engish Math Reading Science Calculate, for the composite and each of the subject areas, the difference between the national average and the Oklahoma scores. Composite English Math Reading Science Express each difference as a percentage of the national score. (Round your answers to two decimal places.) Composite English Math Reading Science eBookarrow_forward
- In the July 2005 issue of a particular magazine, a special advertising section focused on private jets. Included in the section was an article about "fractional" jet ownership, in which wealthy individuals and companies share ownership in private jets. The idea is that the expensive airplanes can be better utilized if more than one individual or company has an ownership stake. Data were collected which show the number of fractional ownerships since 1986. Using these data, develop a line chart that displays the trend in fractional ownership between 1986 and 2004. E Click the icon to view the data on fractional jet ownership. i Data Table Choose the correct graph below. O A. OB. В. Oc. OD. Year Number of Jet 3 7000- 2006T 7000- 1986 16 of 2006- 1987 17 1988 20 1989 26 1986- 1990 29 1986 2006 19864 7000 Frac. Ownership of Jets 1986 2006 7000 Frac. Ownership of Jets Year 1991 34 Year 1992 47 Discuss the relationship between the variables. Choose the correct answer below. 1993 106 1994 122…arrow_forwardThe following headline refers to change. Identify the change as absolute or relative. “Another 22% tuition decrease is expected.” Absolute changeRelative changearrow_forwardA. discuss the time period(s) when the sales trend is increasing, B. and when it is decreasing. C. Also indicate any periods where the trend stayed constant (that is, it did not change).arrow_forward
- mex PLC has gathered following information on the sales of face mask from April 2020 to september 2020. Month Sales ($) April 17,000 May 18,000 June 19,500 July 22,000 August 21,000 September 23,000 You are required to3; a. Using linear trend equation forecast the sales of face masks for October 2020.arrow_forwardthe following table showsthe relationship between your wealth and your utility.arrow_forwardThe stacked column graph below shows additional information from the Bureau of Labor Statistics¹ about employment and education for two groups of workers in the United States compared with the graph discussed in the in-class activity. This graph includes data about workers aged 65 and older. Percentage Employment distribution of workers by education 1997 and 2007 2007 Age 65 and older Pocholode higher's degree. college or associate graduates college mless than a high school. diploma Part A: Use the graph to estimate the following information for the Age 65 and older group and complete the following table. 2007 Age 65 and older 1997 % % % % % % Bachelor's degree or higher Some college or associate degree High school graduates, no college % % Less than a high school diploma % AP % Totalarrow_forward
- The side-by-side bar graph available below shows the approximate average grade point average for the years 1991-1992, 1996-1997, 2001-2002, and 2006-2007 for colleges and universities. Complete parts (a) through (c) below. Click the icon to view the side-by-side bar graph. (a) Does the graph suggest that grade inflation is a problem in colleges? A. Yes, because the GPAS increased over time for all schools. B. No, because nothing can be concluded about individual GPAS from the averages. C. No, because the GPAS are different for each time period. D. Yes, because the GPAS are greater for private schools for every time period. (b) In public schools, the average GPA was 2.86 in 1991-1992 and 3.02 in 2006-2007. In private schools, the average GPA was 3.09 in 1991-1992 and 3.30 in 2006-2007. Determine the percentage increase in GPAs for public schools from 1991 to 2006. Determine the percentage increase in GPAs for private schools from 1991 to 2006. Which type of institution appears to have…arrow_forwardSolve. If necessary, round to the nearest tenth of a percent. The graph below shows the total earnings of the top 30 members of the Ladies Professional Golf Association (LPGA) golf tour. What was the percent decrease in total earnings between the years 2009 and 2010? % 35 31.6 28.8 30 -27.5 25.4 25 20 15 10 5 2007 2008 2009 2010 Total Earnings of Top 30 LPGA Members Dollars (in millions)arrow_forwardAmex PLC has gathered following information on the sales of face mask from April 2020 toSeptember 2020.Month Sales ($)April 17,000May 18,000June 19,500July 22,000August 21,000September 23,000You are required to;a. Using linear trend equation forecast the sales of face masks for October 2020.arrow_forward
 Glencoe Algebra 1, Student Edition, 9780079039897...AlgebraISBN:9780079039897Author:CarterPublisher:McGraw Hill