Concept explainers
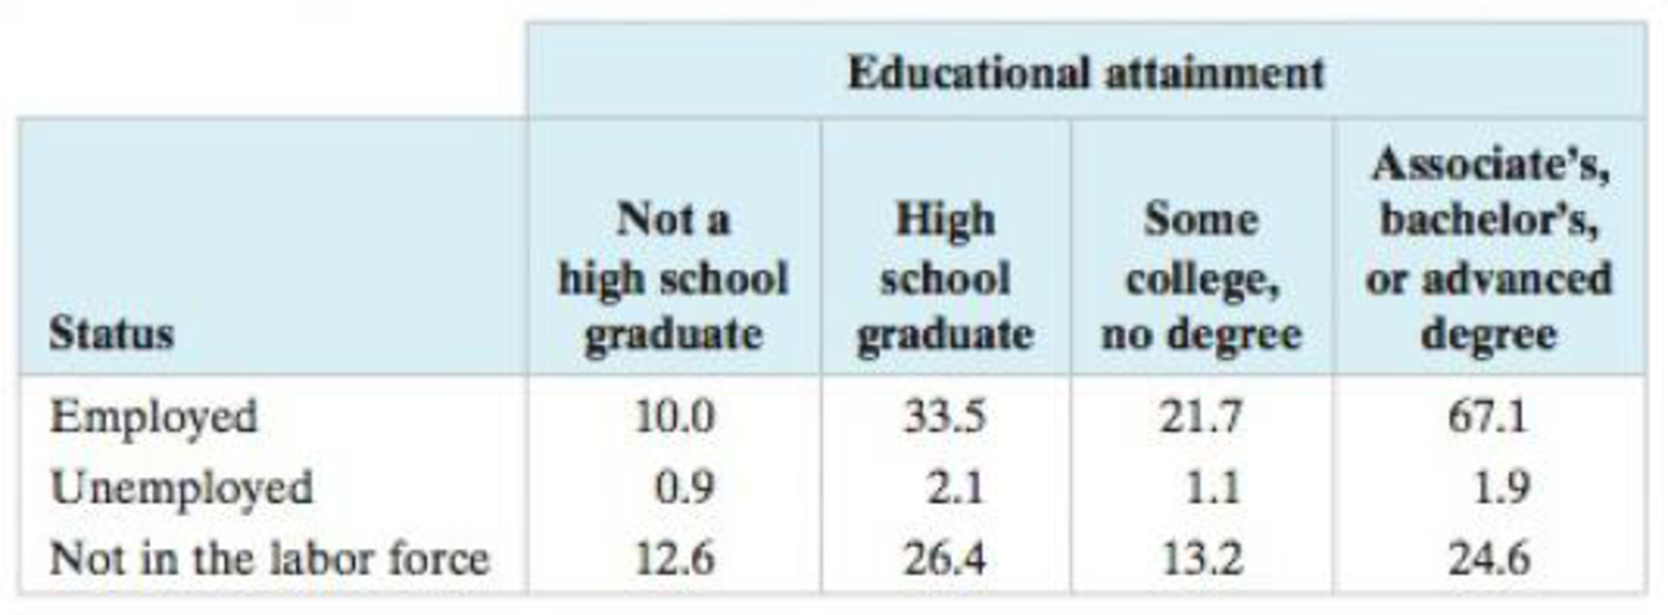
Conditional Relative Frequencies In Exercises 37−42, use the
Relative frequencies can also be calculated based on the row totals (by dividing each row entry by the row’s total) or the column totals (by dividing each column entry by the column’s total). These frequencies are conditional relative frequencies and can be used to determine whether an association exists between two categories in a contingency table.
41. What percent of U.S. adults ages 25 and over who have a degree are not in the labor force?
Contingency Tables and Relative Frequencies In Exercises 33−36, use the information below.
The frequencies in a contingency table can be written as relative frequencies by dividing each frequency by the sample size. The contingency table below shows the number of U.S. adults (in millions) ages 25 and over by employment status and educational attainment. (Adapted from U.S. Census Bureau)

Want to see the full answer?
Check out a sample textbook solution
Chapter 10 Solutions
Elementary Statistics: Picturing the World (7th Edition)
- Pet Owners According to the Humane Society, in 2015, 65% of U.S. households owned at least one pet, and 42% of households who did own pets owned at least two. The U.S. Census Bureau tells us that there were 117 million households in 2015. How many households owned at least two pets? Report your answer in millions rounded to two places.arrow_forwardCholesterol Cholesterol in human blood is necessary, but too much can lead to health problems. There are three main types of cholesterol: HDL (high-density lipoproteins), LDL (low-density lipoproteins), and VLDL (very low-density lipoproteins). HDL is considered “good” cholesterol; LDL and VLDL are considered “bad” cholesterol. A standard fasting cholesterol blood test measures total cholesterol, HDL cholesterol, and triglycerides. These numbers are used to estimate LDL and VLDL, which are difficult to measure directly. Your doctor recommends that your combined LDL/VLDL cholesterol level be less than 130 milligrams per deciliter, your HDL cholesterol level be at least 60 milligrams per deciliter, and your total cholesterol level be no more than 200 milligrams per deciliter. (a) Write a system of linear inequalities for the recommended cholesterol levels. Let x represent the HDL cholesterol level, and let y represent the combined LDL VLDL cholesterol level. (b) Graph the system of inequalities from part (a). Label any vertices of the solution region. (c) Is the following set of cholesterol levels within the recommendations? Explain. LDL/VLDL: 120 milligrams per deciliter HDL: 90 milligrams per deciliter Total: 210 milligrams per deciliter (d) Give an example of cholesterol levels in which the LDL/VLDL cholesterol level is too high but the HDL cholesterol level is acceptable. (e) Another recommendation is that the ratio of total cholesterol to HDL cholesterol be less than 4 (that is, less than 4 to 1). Identify a point in the solution region from part (b) that meets this recommendation, and explain why it meets the recommendation.arrow_forwardThe contingency table below shows the number of adults in a nation (in millions) ages 25 and over by employment status and educational attainment. Rewrite the frequencies in the table as relative frequencies by dividing each frequency by the sample Educational Attainment Not a high school graduate High school graduate Some college, Associate's, bachelor's, or advanced degree Status size. no degree Employed Unemployed 10.9 34.7 30.4 42.6 2.2 2.8 2.7 3.7 Not in the labor force 12.3 20.7 9.7 16.6 ..... Educational Attainment Complete the table of relative frequencies to the right. Not a high school graduate High school graduate Some college, no degree Associate's, bachelor' or advanced degree Status Employed Unemployed Not in the labor force (Round to three decimal places as needed.)arrow_forward
- Question-based on, "sectors"... Also, please explain how to find the sector... I have tried it but still struggling with finding an answer... Any help would be appreciated.arrow_forwardHelparrow_forwardHi, could you please solve the questions using R? For the questions use the data I provided in the screenshot. Please, write the codes with the explanations Thank you.arrow_forward
- Helping tags: Statistics, Math . . . WILL UPVOTE, just pls help me answer question 1 (PARTS B & C) and show complete solution. Thank you!arrow_forward4arrow_forwardHow do college professors spend their time? The National Education Association Almanac of Higher Education gives the following average distribution of professional time allocation: teaching, 44%; research, 15%; professional growth, 9%; community service, 11%; service to the college, 11%; and consulting outside the college, 10%. Make a pie chart showing the allocation of professional time for college professors. (choose one of the options)arrow_forward
- 8) The Pie Chart shows a study of 400 road accidents and what caused them. Underage Driving 15 % Wrong 15 % Parking Speeding Beyond Limits Talking Mobile Ignoring Rules Is the data Qualitative or Quantitative? What is the mode? How many accidents were caused by Speeding? accidentsarrow_forwardDoes role at a University affect one’s willingness to be vaccinated? The partial results of a survey are in the table below. What should the number of students be so that Role (faculty/student) and willingness to be vaccinated are independent? Role Willing to be Vaccinated? Student Faculty Total Yes 304 57 No 18 Totalarrow_forwardNeed help on the last partarrow_forward

 Glencoe Algebra 1, Student Edition, 9780079039897...AlgebraISBN:9780079039897Author:CarterPublisher:McGraw Hill
 Holt Mcdougal Larson Pre-algebra: Student Edition...AlgebraISBN:9780547587776Author:HOLT MCDOUGALPublisher:HOLT MCDOUGAL
 Functions and Change: A Modeling Approach to Coll...AlgebraISBN:9781337111348Author:Bruce Crauder, Benny Evans, Alan NoellPublisher:Cengage Learning
 Big Ideas Math A Bridge To Success Algebra 1: Stu...AlgebraISBN:9781680331141Author:HOUGHTON MIFFLIN HARCOURTPublisher:Houghton Mifflin Harcourt
 College Algebra (MindTap Course List)AlgebraISBN:9781305652231Author:R. David Gustafson, Jeff HughesPublisher:Cengage Learning


