
EBK STATISTICS FOR BUSINESS AND ECONOMI
13th Edition
ISBN: 8220103633567
Author: Sincich
Publisher: PEARSON
expand_more
expand_more
format_list_bulleted
Concept explainers
Videos
Textbook Question
Chapter 10.2, Problem 10.9ACB
Museum management. Refer to the Museum Management and Curatorship (June 2010) worldwide survey of 30 leading museums of contemporary art, Exercise 2.14 (p. 50). Recall that each museum manager was asked to provide the performance measure used most often for internal evaluation. A summary of the results is provided in the table (next column). The data were analyzed using a chi-square test for a multinomial experiment. The results are shown in the Minitab printout on the previous page.
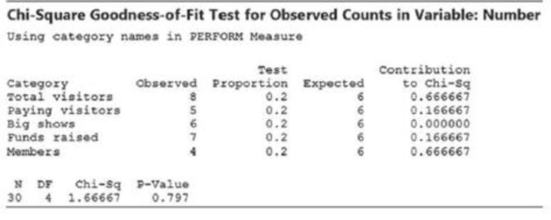
Minitab output for Exercise 10.9
| Performance Measure | Number of Museums |
| Total visitors | 8 |
| Paying visitors | 5 |
| Big shows | 6 |
| Funds raised | 7 |
| Members | 4 |
- a. Is there evidence to indicate that one performance measure is used more often than any of the others? Test using α = .10.
- b. Find a 90% confidence interval for the proportion of museums worldwide that use total visitors as their performance measure. Interpret the result.
Expert Solution & Answer
Want to see the full answer?
Check out a sample textbook solution
Students have asked these similar questions
In a study aimed at creating reference values, abdominal circumference (measured in cm) was measured in adult men. It was found that the relationship to age could be described as abdominal circumference = 82 + 0.3 x age
a) What is the analysis that produces such a formula called?
b) At what age is the average abdominal circumference 100 cm?
A researcher investigated whether a father's level of optimism was predictive of his son's optimism as a young adult. Twenty (20) fathers and sons who agreed to participate in the study were administered a scale measuring their current level of optimism (the scale ranged from 10 to 50), with higher scores indicating greater optimism.
Recently the European Community (EC) decided to lower its subsidies to makers of pasta. In deciding by what amount to reduce total subsidies, experiments were carried out for determining the possible reduction in exports, mainly to the United States, that would result from the subsidy reduction. Over a small range of values, economists wanted to test whether there is a positive correlation between level of subsidy and level of exports. A computer simulation of the economic variables involved in the pasta exports market was carried out. The results follow. Assuming that the simulation is an accurate description of reality and that the values obtained may be viewed as a random sample of the populations of possible outcomes, state whether you believe that a positive rank correlation exists between subsidy level and exports level over the short range of values studied Q
Chapter 10 Solutions
EBK STATISTICS FOR BUSINESS AND ECONOMI
Ch. 10.2 - Find the rejection region for a one-dimensional 2...Ch. 10.2 - What are the characteristics of a multinomial...Ch. 10.2 - What conditions must n satisfy to make the 2 test...Ch. 10.2 - A multinomial experiment with k = 3 cells and n =...Ch. 10.2 - Prob. 10.5LMCh. 10.2 - Cable TV subscriptions and cord cutters. Refer to...Ch. 10.2 - Do social robots walk or roll? Refer to the...Ch. 10.2 - Rankings of MBA programs. Business Ethics (Fall...Ch. 10.2 - Museum management. Refer to the Museum Management...Ch. 10.2 - Offshoring companies. Offshoring is a term that...
Ch. 10.2 - Prob. 10.11ACICh. 10.2 - Prob. 10.12ACICh. 10.2 - Mobile device typing strategies. Text messaging on...Ch. 10.2 - Prob. 10.14ACICh. 10.2 - Coupon user study. A hot topic in marketing...Ch. 10.2 - Cell phone user survey. If you subscribe to a cell...Ch. 10.2 - Overloading in the trucking industry. Although...Ch. 10.2 - Political representation of religious groups. Do...Ch. 10.3 - Find the rejection region for a test of...Ch. 10.3 - Consider the 2 3 (i e., r = 2 and = 3)...Ch. 10.3 - Refer to Exercise 10.20. a. Convert the frequency...Ch. 10.3 - Test the null hypothesis of independence of the...Ch. 10.3 - Refer to Exercise 10.22. a. Convert the responses...Ch. 10.3 - Safety of hybrid cars. According to the Highway...Ch. 10.3 - Purchasing souvenirs. A major tourist activity is...Ch. 10.3 - Prob. 10.26ACBCh. 10.3 - Are travel professionals equitably paid? Business...Ch. 10.3 - Eyewitnesses and mugshots. Refer to the Applied...Ch. 10.3 - Package design influences taste. Can the package...Ch. 10.3 - Job satisfaction of women in construction. The...Ch. 10.3 - Offshoring companies. Refer to The Journal of...Ch. 10.3 - Prob. 10.32ACICh. 10.3 - Prob. 10.33ACICh. 10.3 - Prob. 10.34ACICh. 10.3 - Prob. 10.35ACICh. 10.3 - Prob. 10.36ACICh. 10.3 - Prob. 10.37ACICh. 10.3 - Coupon user study. Refer to the study of a...Ch. 10.3 - Examining the Monty Hall Dilemma. In Exercise...Ch. 10 - A random sample of 250 observations was classified...Ch. 10 - Prob. 10.41LMCh. 10 - Made in the USA survey. Refer to the Journal of...Ch. 10 - Prob. 10.43ACBCh. 10 - Survey on giving and volunteering (continued)....Ch. 10 - Stereotyping in deceptive and authentic news...Ch. 10 - Prob. 10.46ACBCh. 10 - Prob. 10.47ACICh. 10 - Pig farm study. An article in Sociological Methods...Ch. 10 - Management system failures. Refer to the Process...Ch. 10 - History of corporate acquisitions. Refer to the...Ch. 10 - Creating menus to influence others. Refer to the...Ch. 10 - Prob. 10.52ACICh. 10 - Prob. 10.53ACICh. 10 - Prob. 10.54ACICh. 10 - Flight lesponse of geese to helicopter traffic....Ch. 10 - Prob. 10.56ACACh. 10 - Goodness-of-fit test. A statistics analysis is to...Ch. 10 - Prob. 10.58CTCCh. 10 - A television station has hired an independent...Ch. 10 - Suppose the television station believes that a...Ch. 10 - Generalize the situations in Exercises 1 and 2 to...Ch. 10 - In this Activity, you will revisit Activity 3.1,...Ch. 10 - Prob. 10.2.2ACh. 10 - Perform a x2 test for independence for the example...
Knowledge Booster


Learn more about
Need a deep-dive on the concept behind this application? Look no further. Learn more about this topic, economics and related others by exploring similar questions and additional content below.Similar questions
- UBC coaching center has two branches in Dhaka: one in Dhanmondi (Branch A) and another one in Mohammadpur (Branch B). To understand their students' performance, the coaching center conducts the same test in both branches. A sample of 8 students have been selected from branches A and B respectively, and the following table shows data on their performance. Use appropriate non-parametric methods on the data to find out whether there is a statistically significant correlation between the ranks of the students’ performance of the two branches.?arrow_forwardManufacturers of tires report that car tires should be able to last an average of 50,000 miles. A new tire company produces a different type of tread and tests 100 randomly selected tires. This sample of 100 tires lasted an average of 51,500 miles. Assuming the new type of tread does not improve the mileage of the tire, 200 sample means were simulated and displayed on the dotplot. Simulated Tire Mileage +++ +++H 47,000 48,000 49,000 50,000 51,000 52,000 53,000 Mean mileage Using the dotplot and the sample mean mileage, is there convincing evidence that the new type of tread improves the mileage of the tire? Yes, because a mean mileage of 51,500 or more occurred only 14 out of 200 times, the mean mileage is statistically significant. There is convincing evidence the new type of tire tread improves mileage of the tire. Yes, because a mean mileage of 51,500 or less occurred 186 out of 200 times, the mean mileage is statistically significant. There is convincing evidence the new type of…arrow_forwardA study was done in 1998 by Dr. Benjamin Levine to explore the role of altitude training in athletic performance. First, he trained athletes at low altitude, then measured their finish times in a 5 kilometer run. Then the athletes were placed into one of the following groups: I, living and training at high altitude; Il, living at high altitude and training at low; or Ill, living and training at low altitude. The athletes were then retested in another low-altitude 5 K race. In this study, what are the control and experimental data? What are the dependent and independent variables? The results are expressed as average change in speed of each group. I: -3.4 sec., Il: +13.4 sec., Ill: -26.7 sec. a. Graph and interpret the results. b. Did the results surprise you? Why or why not? c. Explain why the three groups obtained the results presented? d.How did altitude affect blood composition and why? e.How would athletes' performance be affected if they live, train, and compete at different…arrow_forward
- What sampling technique is used? In a research class of 40 students, the teacher divides the class into five groups, each with eight members per group. The teacher then asked the class to choose their group members based on interests, compatibility, and rapport. After the selection was made, the teacher realized that the abilities per group were uneven. He then reshuffled some members of the group to achieve equilibrium among the groups. The teacher needs ten students to represent each group. He selected one male and one female from each group based on academic performance, leadership skills, and social skills as qualities that will embody as representatives per group.arrow_forward7. A television station wishes to study the relationship between viewership of its 11 p.m. news program and viewer age (18 years or less, 19 to 35, 36 to 54, 55 or older). A sample of 250 television viewers in each age group is randomly selected, and the number who watch the station’s 11 p.m. news is found for each sample. The results are given in the table below.arrow_forwardA company is considering an organizational change which entails adopting the use of self-managed work teams which they hope will lead to higher levels of employee satisfaction. In order to assess the attitudes of employees of the company towards this change a sample of 250 employees was selected and asked whether they favor the institution of self-managed teams. Three responses were allowed: favor, neutral or oppose. The observed frequency of the results of the survey are shown below: Opinion Type of Job Favor Neutral Oppose Total Hourly Worker 25 40 35 100 Supervision 45 35 20 100 Manager 20 15 15 50 Total 90 90 70 250 Use this data to test the hypothesis that opinion and type of job are independent at the .025 level.arrow_forward
- Allegiant Airlines is considering an overbooking policy for one of its flights. The airplane has 50 seats, but Allegiant is considering accepting more reservations than seats because sometimes passengers do not show up for their flights, resulting in empty seats. The PassengerAppearance worksheet in the file Overbooking contains data on 1,000 passengers showing whether or not they showed up for their respective flights. In addition, Allegiant has conducted a field experiment to gauge the demand for reservations for the current flight. During this experiment, they did not limit the number of reservations for the flight to observe the uncensored demand. The following table summarizes the result of the field experiment. No. of Reservations Demanded Probability 48 0.05 49 0.05 50 0.15 51 0.30 52 0.25 53 0.10 54 0.10 Suppose Allegiant receives a marginal profit of $108 for each passenger who books a reservation (regardless of whether they show up). In addition, suppose…arrow_forwardThe Chi-Squared Test - X² Choco-Zuties, and the other ad was for a new healthy snack called Apple-Zuties. Product advertisers studied the effects of television ads on children's choices for two new snacks. The advertisers used two 30-second television ads in an experiment. One ad was for a new sugary snack called program, the children were offered a choice between the two snacks. The table below summarizes their choices. individually watched a 30-minute television program that was interrupted for 5 minutes of advertising. After the For the experiment, 75 children were randomly assigned to one of three groups, A, B, or C. Each child Number Who Chose Choco-Zuties 21 13 22 Group A B с Kristin Trehame 11-30-20 Chapter 11 Analyzing the Association Between Categorical Variables Type of Ad Choco-Zuties only Apple-Zuties only Neither Number Who Chose Apple-Zuties 4 12 x²=(obs-exp)² exp Do the data provide convincing statistical evidence that there is an association between type of ad and…arrow_forwardProblem Set #3 J) The amount of income spent on housing is an important component of the cost of living. The total costs of housing for homeowners might include mortgages payments, property taxes, and utility costs (water, heat, electricity). An economist selected a sample of Inland Empire, California, homeowners and calculated housing costs as a percent of monthly income, 5 years ago and now. The information is reported below. Is it reasonable to conclude the percent is less now than 5 years ago? Apply the 6-step hypothesis testing procedure to test using a = 5% (0.05). (LMW) Five Years Now Ago Aziz 18 11 Baker 19 38 Cortez 28 36 Duran 42 26 Edgewort 35 11 Foster 44 42 Gomez 46 Hochhack 20 27 Isoko 48 27 Jarvis 48 25 Kenda 36 33 Li 17 33 Morales 24 22 Nasser 32 11 Oliphant 43 39 Pierce 45 43 Quest 29 23 Rawlins 28 18 Sorrento 40 36 Thomas 23 13arrow_forward
- A number of particular articles has been classified according to their weights. After drying for two weeks the same articles have again been weighted and similarly classified. It is known that the median weight in the first weighing was 20-83 gm. while in the second weighing it was 17-35 gm. Some frequencies a and b in the first weighing and x and y in the second are missing. It is known that a = x and b missing frequencies. 1 5 y. Find out the values of the Class Frequencies Class Frequencies 1st weighing 2nd weighing 1st weighing 2nd weighing 0-5 15-20 52 a 50 5-10 20-25 75 30 10-15 11 40 25-30 22 28arrow_forwardA manufacturer of cat food was planning to survey households in the US to determine purchasing habits of cat owners. Among the questions to be included are those that relate to Where cat fat is primarily purchased. Whether dry or moist cat food is purchased. The number of cats living in the household. Whether the cat is pedigreed. Describe the population. For each of the four items listed, indicate whether the variable is categorical or numerical.arrow_forwardAccording to Wine-Searcher, wine critics generally use a wine-scoring scale to communicate their opinions on the relative quality of wines. Wine scores range from 0 to 100, with a score of 95 – 100 indicating a great wine, 90 – 94 indicating an outstanding wine, 85 – 89 indicating a very good wine, 80 – 84 indicating a good wine, 75 - 79 indicating a mediocre wine, and below 75 indicating that the wine is not recommended. Random ratings of a pinot noir recently produced by a newly established vineyard in 2018 follow: Excel File: data07-11.xlsx 87 91 86 82 72 91 60 77 80 79 83 96 a. Develop a point estimate of mean wine score for this pinot noir (to 2 decimals). b. Develop a point estimate of the standard deviation for wine scores received by this pinot noir (to 4 decimals).arrow_forward
arrow_back_ios
SEE MORE QUESTIONS
arrow_forward_ios
Recommended textbooks for you

 Principles of Economics (12th Edition)EconomicsISBN:9780134078779Author:Karl E. Case, Ray C. Fair, Sharon E. OsterPublisher:PEARSON
 Engineering Economy (17th Edition)EconomicsISBN:9780134870069Author:William G. Sullivan, Elin M. Wicks, C. Patrick KoellingPublisher:PEARSON
 Principles of Economics (MindTap Course List)EconomicsISBN:9781305585126Author:N. Gregory MankiwPublisher:Cengage Learning
 Managerial Economics: A Problem Solving ApproachEconomicsISBN:9781337106665Author:Luke M. Froeb, Brian T. McCann, Michael R. Ward, Mike ShorPublisher:Cengage Learning
 Managerial Economics & Business Strategy (Mcgraw-...EconomicsISBN:9781259290619Author:Michael Baye, Jeff PrincePublisher:McGraw-Hill Education
Principles of Economics (12th Edition)
Economics
ISBN:9780134078779
Author:Karl E. Case, Ray C. Fair, Sharon E. Oster
Publisher:PEARSON
Engineering Economy (17th Edition)
Economics
ISBN:9780134870069
Author:William G. Sullivan, Elin M. Wicks, C. Patrick Koelling
Publisher:PEARSON
Principles of Economics (MindTap Course List)
Economics
ISBN:9781305585126
Author:N. Gregory Mankiw
Publisher:Cengage Learning
Managerial Economics: A Problem Solving Approach
Economics
ISBN:9781337106665
Author:Luke M. Froeb, Brian T. McCann, Michael R. Ward, Mike Shor
Publisher:Cengage Learning
Managerial Economics & Business Strategy (Mcgraw-...
Economics
ISBN:9781259290619
Author:Michael Baye, Jeff Prince
Publisher:McGraw-Hill Education
Sampling Methods and Bias with Surveys: Crash Course Statistics #10; Author: CrashCourse;https://www.youtube.com/watch?v=Rf-fIpB4D50;License: Standard YouTube License, CC-BY
Statistics: Sampling Methods; Author: Mathispower4u;https://www.youtube.com/watch?v=s6ApdTvgvOs;License: Standard YouTube License, CC-BY