Financial Accounting
3rd Edition
ISBN: 9780133791129
Author: Jane L. Reimers
Publisher: Pearson Higher Ed
expand_more
expand_more
format_list_bulleted
Videos
Textbook Question
Chapter 10, Problem 6SEA
A five-year comparative analysis of Low Light Company’s
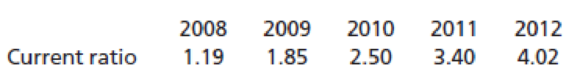
What has been happening to the liquidity of Low Light Company over the five years presented?
Expert Solution & Answer
Want to see the full answer?
Check out a sample textbook solution
Students have asked these similar questions
Crosby Company has provided the following comparative information:
Please see the attachment for details:
You have been asked to evaluate the historical performance of the company over the last five years.Selected industry ratios have remained relatively steady at the following levels for the last five years: 20Y4–20Y8Return on total assets 19%Return on stockholders’ equity 26%Times interest earned 3.4Ratio of liabilities to stockholders’ equity 1.4Instructions1. Prepare four line graphs with the ratio on the vertical axis and the years on the horizontal axis for the following four ratios, rounding ratios and percentages to one decimal place:a. Return…
Compute the following ratios for the most recent two years, show all values in the computations:
1.Current ratio
2.Accounts receivable turnover
3.Debt ratio(TotalLiabilities/Total Assets, as a percentage)
4.Debt-to-equity ratio
Based on the results above,
what conclusions can you make about the liquidity and solvency of the
company?
Six measures of solvency or profitabilityThe following data were taken from the financial statements of GatesInc. for the current fiscal year.
Assuming that long-term investments totaled $3,000,000 throughout theyear and that total assets were $7,000,000 at the beginning of the currentfiscal year, determine the following: (A) ratio of fixed assets to long-termliabilities, (B) ratio of liabilities to stockholders' equity, (C) assetturnover, (D) return on total assets, (E) return on stockholders" equity,and (F) return on common stockholders' equity. (Round ratios andpercentages to one decimal place as appropriate.)
Chapter 10 Solutions
Financial Accounting
Ch. 10 - Prob. 1YTCh. 10 - Prob. 2YTCh. 10 - Prob. 3YTCh. 10 - Prob. 4YTCh. 10 - Prob. 5YTCh. 10 - Define the items that the Financial Accounting...Ch. 10 - Prob. 2QCh. 10 - Prob. 3QCh. 10 - Prob. 4QCh. 10 - Prob. 5Q
Ch. 10 - Prob. 6QCh. 10 - What is solvency? Which ratios are useful for...Ch. 10 - What is profitability? Which ratios are useful for...Ch. 10 - What are market indicators? Which ratios are...Ch. 10 - Prob. 10QCh. 10 - Prob. 1MCQCh. 10 - Current assets for Kearney Company are 120,000 and...Ch. 10 - Prob. 3MCQCh. 10 - Prob. 4MCQCh. 10 - Prob. 5MCQCh. 10 - Prob. 6MCQCh. 10 - Prob. 7MCQCh. 10 - Prob. 8MCQCh. 10 - Prob. 9MCQCh. 10 - Prob. 10MCQCh. 10 - Prob. 1SEACh. 10 - Prob. 2SEACh. 10 - Prob. 3SEACh. 10 - Prob. 4SEACh. 10 - Prob. 5SEACh. 10 - A five-year comparative analysis of Low Light...Ch. 10 - Prob. 7SEACh. 10 - Prob. 8SEBCh. 10 - Prob. 9SEBCh. 10 - Prob. 10SEBCh. 10 - Perform a vertical analysis on the following...Ch. 10 - Prob. 12SEBCh. 10 - Prob. 13SEBCh. 10 - Use the following information to construct a...Ch. 10 - Prob. 16EACh. 10 - Prob. 17EACh. 10 - Prob. 18EACh. 10 - Prob. 19EACh. 10 - Use the balance sheets from Suzannes Hotels in...Ch. 10 - Prob. 21EACh. 10 - Prob. 22EACh. 10 - Prob. 23EACh. 10 - Use the statements of earnings for Campbell Soup...Ch. 10 - Prob. 25EACh. 10 - Prob. 26EACh. 10 - Prob. 27EACh. 10 - Prob. 28EBCh. 10 - Prob. 29EBCh. 10 - Prob. 30EBCh. 10 - Prob. 31EBCh. 10 - Prob. 32EBCh. 10 - Prob. 33EBCh. 10 - Prob. 34EBCh. 10 - Prob. 35EBCh. 10 - Prob. 36EBCh. 10 - Prob. 37EBCh. 10 - Prob. 38EBCh. 10 - Prob. 39EBCh. 10 - Prob. 40EBCh. 10 - Prob. 41PACh. 10 - Prob. 42PACh. 10 - Prob. 43PACh. 10 - Following are the income statements for Alpha...Ch. 10 - Prob. 45PACh. 10 - Prob. 46PACh. 10 - Prob. 47PACh. 10 - You are interested in investing in Teddy Company,...Ch. 10 - Prob. 49PBCh. 10 - Prob. 50PBCh. 10 - Prob. 51PBCh. 10 - Prob. 52PBCh. 10 - Prob. 53PBCh. 10 - Prob. 54PBCh. 10 - Prob. 55PBCh. 10 - Prob. 56PBCh. 10 - Prob. 1CTPCh. 10 - Prob. 2CTP
Knowledge Booster


Learn more about
Need a deep-dive on the concept behind this application? Look no further. Learn more about this topic, accounting and related others by exploring similar questions and additional content below.Similar questions
- Calculate the following five ratios for each of the two years:(i) Return on capital employed(ii) Net profit margin(iii) Current ratio(iv) Average Receivable days/ Debtors collection period(v) Average Payable days/ Creditors collection periodarrow_forwardIntegrative: Complete ratio analysis Given the following financial statements E, historical ratios, and industry averages , calculate Sterling Company's financial ratios for the most recent year. (Assume a 365-day year.) Analyze its overall financial situation from both a cross-sectional and a time-series viewpoint. Break your analysis into evaluations of the firm's liquidity, activity, debt, profitability, and market. The current ratio is 1.59. (Round to two decimal places.) Data table Time-series analysis of the current ratio: Improving (Select from the drop-down menu.) Cross-sectional analysis of the current ratio: Poor (Select from the drop-down menu.) (Click the icon here O in order to copy the contents of the data table below into a spreadsheet.) The quick ratio is 0.84. (Round to two decimal places.) Historical and Industry Average Ratios for Sterling Company Ratio Actual 2020 Actual 2021 Industry average, 2022 Time-series analysis of the quick ratio: (Select from the drop-down…arrow_forwardGiven the following ratios, how well has the company been managing its liquidity for the past two years? Current Year Past Year Ratio Company Industry Company Industry Current ratio 1.9 2.5 1.1 2.3 Quick ratio 0.7 1.0 0.4 0.9 Number of days of receivables 39.0 34.0 44.0 32.5 Number of days of inventory 41.0 30.3 45.0 27.4 Number of days of payables 34.3 36.0 29.4 35.5arrow_forward
- Juroe Company provided the following income statement for last year: Juroes balance sheet as of December 31 last year showed total liabilities of 10,250,000, total equity of 6,150,000, and total assets of 16,400,000. Required: 1. Calculate the return on sales. (Note: Round the percent to two decimal places.) 2. CONCEPTUAL CONNECTION Briefly explain the meaning of the return on sales ratio, and comment on whether Juroes return on sales ratio appears appropriate.arrow_forwardSolvency and profitability trend analysis Addai Company has provided the following comparative information: You have been asked to evaluate the historical performance of the company over the la.st five years. Selected industry ratios have remained relatively steady at the following levels for the last five years: Instructions 1. Prepare four line graphs with the ratio on the vertical axis and the years on the horizontal axis for the following four ratios (round to one decimal place): A. Return on total assetsB. Return on stockholders' equityC. Times interest earnedD. Ratio of liabilities to stockholders' equity Display both the company ratio and the industry benchmark on each graph. That is, each graph should have two lines. 2. Prepare an analysis of the graphs in (1).arrow_forwardWhat is the amount of working capital and the current ratio at the end of this year? What is the acid - test ratio at the end of this year? What is the accounts receivable turnover and the average collection period? What is the inventory turnover and the average sale period? What is the company's operating cycle? What is the total asset turnover? What is the times interest earned ratio? What is the debt-to-equity ratio at the end of this year? Markus Company's common stock sold for $2.75 per share at the end of this year. The company paid a common stock dividend of $0.55 per share this year. It also provided the following data excerpts from this year's financial statements: Ending Balance Beginning Balance Cash Accounts receivable Inventory Current assets Total assets Current liabilities Total liabilities Common stock, $1 par value Total stockholders' equity Total liabilities and stockholders' equity Sales (all on account) Cost of goods sold Gross margin Net operating income Interest…arrow_forward
- Addai Company has provided the following comparative information: You have been asked to evaluate the historical performance of the company over the last five years. Selected industry ratios have remained relatively steady at the following levels for the last five years:2010-2014Rate earned on total assets ........28%Rate earned on stockholders' equity .....18%Number of times interest charges are earned. 2.7Ratio of liabilities to stockholders' equity... 0.4Instructions1. Prepare four line graphs with the ratio on the vertical axis and the years on the horizontal axis for the following four ratios (rounded to one decimal place):a. Rate earned on total assetsb. Rate earned on stockholders' equityc. Number of times interest charges are earnedd. Ratio of liabilities to stockholders' equityDisplay both the company ratio and the industry benchmark on each graph. That is, each graph should have two lines.2. Prepare an analysis of the graphs in(1).arrow_forwardRequired: (a) You are required to calculate the following ratios:(iv) Return on Capital Employed(v) Asset turnover(vi) Non-current asset turnover(vii) Current Ratio(viii) Quick Ratio(ix) Inventory days(x) Receivables days(xi) Payable days(xii) Interest cover (b) In light of your calculations comment on the performance of the company over thelast two years.arrow_forwardLoomis, Inc. reported the following on the company’s income statement in two recent years: Please see the image for details: a. Determine the times interest earned ratio for the current year and the prior year. Round to one decimal place.b. Is this ratio improving or declining?arrow_forward
- The Balance Sheet abstract of a Company for two years are given below. You are required to – 1. Calculate, for the last year Debt-Equity Ratio, Quick Ratio, and Working Capital Turnover Ratio; and 2. Sales Volume required to maintain the same Working Capital Turnover Ratio in last year.arrow_forwardCalculate the following for the Tesla Company from the TWO most recent years: a. any two profitability ratios b. any two activity ratios c. any one debt ratioarrow_forwardCompute the following profitability ratios of the company for the most recent two years, show all values in the computations: 1.Asset Turnover 2.Profit margin ratio(Net Income/Net Sales) 3.Return on total assets (Net Income/Average Total Assets) 4.Return on stockholders’ equity 5.Basic Earnings per share (EPS) Based on the results above, what conclusions can you make about the company’s overall profitability and efficient use of assets?arrow_forward
arrow_back_ios
SEE MORE QUESTIONS
arrow_forward_ios
Recommended textbooks for you
 Financial Reporting, Financial Statement Analysis...FinanceISBN:9781285190907Author:James M. Wahlen, Stephen P. Baginski, Mark BradshawPublisher:Cengage Learning
 Managerial Accounting: The Cornerstone of Busines...AccountingISBN:9781337115773Author:Maryanne M. Mowen, Don R. Hansen, Dan L. HeitgerPublisher:Cengage Learning
 Managerial AccountingAccountingISBN:9781337912020Author:Carl Warren, Ph.d. Cma William B. TaylerPublisher:South-Western College Pub
Financial Reporting, Financial Statement Analysis...
Finance
ISBN:9781285190907
Author:James M. Wahlen, Stephen P. Baginski, Mark Bradshaw
Publisher:Cengage Learning
Managerial Accounting: The Cornerstone of Busines...
Accounting
ISBN:9781337115773
Author:Maryanne M. Mowen, Don R. Hansen, Dan L. Heitger
Publisher:Cengage Learning
Managerial Accounting
Accounting
ISBN:9781337912020
Author:Carl Warren, Ph.d. Cma William B. Tayler
Publisher:South-Western College Pub
Financial ratio analysis; Author: The Finance Storyteller;https://www.youtube.com/watch?v=MTq7HuvoGck;License: Standard Youtube License