Financial Accounting
3rd Edition
ISBN: 9780133791129
Author: Jane L. Reimers
Publisher: Pearson Higher Ed
expand_more
expand_more
format_list_bulleted
Concept explainers
Videos
Textbook Question
Chapter 10, Problem 44PA
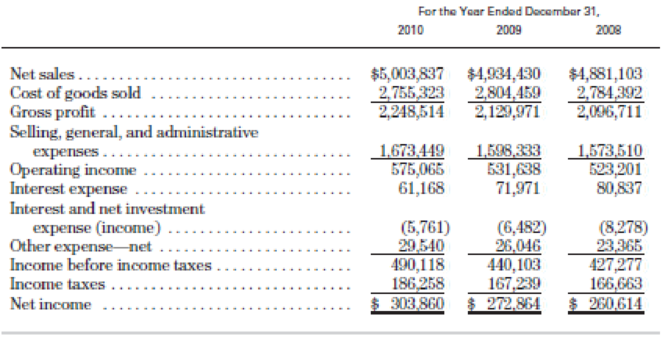
Following are the income statements for Alpha Company:
Alpha Company
Income Statements
(in thousands)
Requirements
- 1. For each of the years shown, prepare a vertical analysis, using sales as the base. Write a paragraph explaining what the analysis shows.
- 2. Using 2008 as the base year, prepare a horizontal analysis for sales and cost of goods sold. What information does this analysis give you?
Expert Solution & Answer
Want to see the full answer?
Check out a sample textbook solution
Students have asked these similar questions
Complete this question by entering your answers in the tabs below.
Analysis Analysis
Bal Sheet Inc Stmt
Prepare a vertical analysis of an income statements for Year 4 and Year 3. (Percentages
may not add exactly due to rounding. Round your answers to 2 decimal places. (i.e., .2345
should be entered as 23.45).)
Revenues
Sales (net)
Other revenues
Total revenues
Expenses
Cost of goods sold
FANNING COMPANY
Vertical Analysis of Income Statements
Year 4
Selling, general, and
administrative expense
Interest expense
Income tax expense
Total expenses
Net income
Amount
$
231,900
9,300
241,200
118,800
54,200
6,800
22,800
202,600
$
38,600
Percentage
of Total
Analysis Bal Sheet
%
%
Year 3
Amount
$
211,200
6,400
217,600
102,100
49,100
6,000
21,800
179,000
$
Percentage
of Total
%
%
38,600
Analysis Inc Stmt >
Show less
Income statements for Campbell Company for Year 3 and Year 4 follow:
CAMPBELL COMPANY
Income Statements
Year 4
Year 3
$180,800
120,400
19,900
14,500
Sales
$200,800
Cost of goods sold
Selling expenses
Administrative expenses
Interest expense
Total expenses
142,400
21,900
12,500
3,900
$180,700
5,900
$160,700
20,100
3,700
Income before taxes
20,100
Income taxes expense
6,500
Net income
$ 13,600
$ 16,400
Required
a. Perform a horizontal analysis, showing the percentage change in each income statement component between Year 3 and Year 4.
b. Perform a vertical analysis, showing each income statement component as a percentage of sales for each year.
Complete this question by entering your answers in the tabs below.
Required A
Required B
Perform a horizontal analysis, showing the percentage change in each income statement component between Year 3 and Year
4. (Negative answers should be indicated by a minus sign. Round your percentage answers to 1 decimal place. (i.e., 0.234
should be entered…
VII. Direction: Compute and interpret.
The following comparative financial statements are provided by Avatar Industries. You were asked
to compute the different financial ratios and provide your interpretations with regards to
profitability, efficiency, liquidity and solvency of the company. Use the Answer Sheet template
below to input your answer and solution.
AVATAR INDUSTRIES
AVATAR INDUSTRIES
Comparative Statement of Financial Position
For the years 2019 and 2018
Comparative Income Statement
For the years 2019 and 2018
2019
2018
2019
2018
ASSETS
Current Assets:
Sales
P200,000
P210,000
Cash & Cash Equivalent
P65,000
P70,000
Sales Returns and Allowances
40,000
25,000
Accounts Receivable
40,000
35,000
Net Sales
160,000
185,000
Marketable Secuities
40,000
35,000
Cost of Goods Sold
100,000
115,625
Inventory
100,000
80,000
Gross Profit
60,000
69,375
Total Current Assets
220,000
200,000 160,000
P445,000 P380,000
245,000
Operating Expenses:
Fixed Assets
Selling Expenses
22,000
25,000
Total…
Chapter 10 Solutions
Financial Accounting
Ch. 10 - Prob. 1YTCh. 10 - Prob. 2YTCh. 10 - Prob. 3YTCh. 10 - Prob. 4YTCh. 10 - Prob. 5YTCh. 10 - Define the items that the Financial Accounting...Ch. 10 - Prob. 2QCh. 10 - Prob. 3QCh. 10 - Prob. 4QCh. 10 - Prob. 5Q
Ch. 10 - Prob. 6QCh. 10 - What is solvency? Which ratios are useful for...Ch. 10 - What is profitability? Which ratios are useful for...Ch. 10 - What are market indicators? Which ratios are...Ch. 10 - Prob. 10QCh. 10 - Prob. 1MCQCh. 10 - Current assets for Kearney Company are 120,000 and...Ch. 10 - Prob. 3MCQCh. 10 - Prob. 4MCQCh. 10 - Prob. 5MCQCh. 10 - Prob. 6MCQCh. 10 - Prob. 7MCQCh. 10 - Prob. 8MCQCh. 10 - Prob. 9MCQCh. 10 - Prob. 10MCQCh. 10 - Prob. 1SEACh. 10 - Prob. 2SEACh. 10 - Prob. 3SEACh. 10 - Prob. 4SEACh. 10 - Prob. 5SEACh. 10 - A five-year comparative analysis of Low Light...Ch. 10 - Prob. 7SEACh. 10 - Prob. 8SEBCh. 10 - Prob. 9SEBCh. 10 - Prob. 10SEBCh. 10 - Perform a vertical analysis on the following...Ch. 10 - Prob. 12SEBCh. 10 - Prob. 13SEBCh. 10 - Use the following information to construct a...Ch. 10 - Prob. 16EACh. 10 - Prob. 17EACh. 10 - Prob. 18EACh. 10 - Prob. 19EACh. 10 - Use the balance sheets from Suzannes Hotels in...Ch. 10 - Prob. 21EACh. 10 - Prob. 22EACh. 10 - Prob. 23EACh. 10 - Use the statements of earnings for Campbell Soup...Ch. 10 - Prob. 25EACh. 10 - Prob. 26EACh. 10 - Prob. 27EACh. 10 - Prob. 28EBCh. 10 - Prob. 29EBCh. 10 - Prob. 30EBCh. 10 - Prob. 31EBCh. 10 - Prob. 32EBCh. 10 - Prob. 33EBCh. 10 - Prob. 34EBCh. 10 - Prob. 35EBCh. 10 - Prob. 36EBCh. 10 - Prob. 37EBCh. 10 - Prob. 38EBCh. 10 - Prob. 39EBCh. 10 - Prob. 40EBCh. 10 - Prob. 41PACh. 10 - Prob. 42PACh. 10 - Prob. 43PACh. 10 - Following are the income statements for Alpha...Ch. 10 - Prob. 45PACh. 10 - Prob. 46PACh. 10 - Prob. 47PACh. 10 - You are interested in investing in Teddy Company,...Ch. 10 - Prob. 49PBCh. 10 - Prob. 50PBCh. 10 - Prob. 51PBCh. 10 - Prob. 52PBCh. 10 - Prob. 53PBCh. 10 - Prob. 54PBCh. 10 - Prob. 55PBCh. 10 - Prob. 56PBCh. 10 - Prob. 1CTPCh. 10 - Prob. 2CTP
Knowledge Booster


Learn more about
Need a deep-dive on the concept behind this application? Look no further. Learn more about this topic, accounting and related others by exploring similar questions and additional content below.Similar questions
- Cuneo Companys income statements for the last 3 years are as follows: Refer to the information for Cuneo Company above. Required: 1. Prepare a common-size income statement for Year 1 by expressing each line item as a percentage of sales revenue. (Note: Round percentages to the nearest tenth of a percent.) 2. Prepare a common-size income statement for Year 2 by expressing each line item as a percentage of sales revenue. (Note: Round percentages to the nearest tenth of a percent.) 3. Prepare a common-size income statement for Year 3 by expressing each line item as a percentage of sales revenue. (Note: Round percentages to the nearest tenth of a percent.)arrow_forwardJasmine Company provided the following income statements for its first 3 years of operation: Refer to the information for Jasmine Company above. Required: Prepare common-size income statements by using net sales as the base. (Note: Round answers to the nearest whole percentage.)arrow_forwardVII. Direction: Compute and interpret. The following comparative financial statements are provided by Avatar Industries. You were asked to compute the different financial ratios and provide your interpretations with regards to profitability, efficiency, liquidity and solvency of the company. Use the Answer Sheet template below to input your answer and solution. AVATAR INDUSTRIES AVATAR INDUSTRIES Comparative Statement of Financial Position For the years 2019 and 2018 Comparative Income Statement For the years 2019 and 2018 2019 2018 2019 2018 ASSETS Current Assets: Sales P200,000 P210,000 Cash & Cash Equivalent P65,000 P70,000 Sales Returns and Allowances 40,000 25,000 Accounts Receivable 40,000 35,000 Net Sales 160,000 185,000 Marketable Securities 40,000 35,000 Cost of Goods Sold 100,000 115,625 Inventory 100,000 80,000 Gross Profit 60,000 69,375 Total Current Assets 245,000 220,000 Operating Expenses: Fixed Assets 200,000 160,000 Selling Expenses 22,000 25,000 Total Assets P445,000…arrow_forward
- Refer to the information for Sundahl Company on the previous page.Required:1. Prepare a common-size income statement for Year 1 by expressing each line item as apercentage of sales revenue. (Note: Round percentages to the nearest tenth of a percent.)2. Prepare a common-size income statement for Year 2 by expressing each line item as apercentage of sales revenue. (Note: Round percentages to the nearest tenth of a percent.)arrow_forwardA company’s comparative statements are given below. Please conduct the following analyses (hint: use of a spreadsheet is recommended for ease of computation):a. Horizontal analysis (trend analysis) on the income statement b. Vertical analysis (common size financial statement analysis) on the income statement c. Calculate the three profitability ratios for the year 2017 and show how ROE can be derived from the DuPont formula for this company. d. What do the analyses tell you about the company’s financial performance?arrow_forwardPerform a vertical analysis of the P&L (FS Company). "Formula: Vertical Analysis % Each income statement items / Revenues (or Net sales) Fill in each Blank. Round your answers to the nearest tenth percent, i.e. 4.5%. PLEASE SUBMIT YOUR ANSWERS IN % and include the % symbol. Do not leave any blank. If the answer is 0, be sure to put 0. Cost of goods sold Gross profit Net sales $858,000 Select] Other expenses Interest revenue Income from operations Interest expense 2018 Income before income taxes Income tax expense Net income 513,000 345,000 244,000 101,000 4,000 24,000 81,000 33,000 FS Company Comparative P&L statement Years Ended December 31, 2018 and 2017 48,000 % of sales Select J [Select] | Select | [Select] [Select] [Select] [ Select] Select] Select > >arrow_forward
- Income statements for Walton Company for Year 3 and Year 4 follow: WALTON COMPANY Income Statements. Sales Cost of goods sold. Selling expenses Administrative expenses Interest expense Total expenses Income before taxes Income taxes expense Net income Required A Required B Year 4 $200, 300 143,300 20,900 12,900 3,200 Required a. Perform a horizontal analysis, showing the percentage change in each income statement component between Year 3 and Year 4. b. Perform a vertical analysis, showing each income statement component as a percentage of sales for each year. Sales Cost of goods sold Selling expenses Administrative expenses Interest expense Total expenses Income before taxes Income taxes expense Net income $180,300 $160,300 20,000 20,000 3,300 5,600 $ 14,400 $ 16,700 Complete this question by entering your answers in the tabs below. Year 3 $180,300 X Answer is complete but not entirely correct. Perform a vertical analysis, showing each income statement component as a percentage of…arrow_forwardUsing Pfizer’s Income Statement, perform a horizontal analysis and answer the following questions: 1. What can you say about the company’s performance throughout the years? 2. What can you say about the sales performance of the company from 2008 to 2009? Research on what could have happened during that period which led to the results of your horizontal analysis?arrow_forward6. The following is the adjusted trial balance data for Nino's Pizzenia as of December 31, 2019. NINO'S PIZZERIA Adjusted Trlal Balance Year Ended December 31,2019 Debit Credit S 775,984 45,688 200,460 135,624 Cash Accounts Receivable Buildings Merchandise Inventory Accounts Payable Common Stock Sales Interest Revenue Rent Revenue Sales Salaries Expense office Supplies Expense Sales Discounts Interest Expense Sales Returns and Allowances, Cost of goods sold Rent Expense Depreciation Expense: Office Equipment Insurance Expense Advertising Expense Totals $437,880 410,542 555,696 84,652 86,900 24,500 6,270 102,890 4,577 105.854 122,853 20.000 10.555 2,780 17:635 $1,575,670 $1,575,670arrow_forward
- Top executive officers of Tildon Company, a merchandising firm, are preparing the next year's budget. The controller has provided everyone with the current year's projected income statement. Current Year $1,600,000 1,120,000 480,000 190,000 Sales revenue Cost of goods sold Gross profit Selling & administrative expenses Net income 290,000 Cost of goods sold is usually 70 percent of sales revenue, and selling and administrative expenses are usually 10 percent of sales plus a fixed cost of $30,000. The president has announced that the company's goal is to increase net income by 15 percent. Required The following items are independent of each other: a. Prepare a pro forma income statement. What percentage increase in sales would enable the company to reach its goal? b. The market may become stagnant next year, and the company does not expect an increase in sales revenue. The production manager believes that an improved production procedure can cut cost of goods sold by 2 percent. Prepare a…arrow_forwardUse the following selected data from Business Solutions's income statement for the three months ended March 31, 2022, and from its March 31, 2022, balance sheet to complete the requirements. Computer services revenue Net sales (of goods) Total sales and revenue Cost of goods sold Net income Quick assets Current assets Total assets Current liabilities Total liabilities Total equity Required: 1. Compute the gross margin ratio (both with and without services revenue) and net profit margin ratio. 2. Compute the current ratio and acid-test ratio. 3. Compute the debt ratio and equity ratio. 4. What percent of its assets are current? What percent are long term? Required 1 Required 2 Complete this question by entering your answers in the tabs below. $ 27,275 19,083 46,358 12,572 18,807 89,252 97,520 123,464 Gross margin ratio Net profit main ratio 885 885 122,579 Required 3 Required 4 Compute the gross margin ratio (both with and without services revenue) and net profit margin ratio. Note:…arrow_forwardAlex is currently considering to invest his money in one of the companies betweenCompany A and Company B. The summarized final accounts of the companies for theirlast completed financial year are as follows: (refer to the images) Required:a. Calculate the following ratios for Company A and Company B. State clearly theformulae used for each ratio:i. Gross Profit Marginii. Net Profit Marginiii. Inventory Turnover Period (days)iv. Receivables Collection Period (days)v. Payables Payment Period (days)vi. Current Ratiovii. Quick Ratiob. Comment on each of the ratios calculated in part (a) above.arrow_forward
arrow_back_ios
SEE MORE QUESTIONS
arrow_forward_ios
Recommended textbooks for you
 Financial AccountingAccountingISBN:9781337272124Author:Carl Warren, James M. Reeve, Jonathan DuchacPublisher:Cengage Learning
 Managerial Accounting: The Cornerstone of Busines...AccountingISBN:9781337115773Author:Maryanne M. Mowen, Don R. Hansen, Dan L. HeitgerPublisher:Cengage Learning
 Principles of Accounting Volume 1AccountingISBN:9781947172685Author:OpenStaxPublisher:OpenStax College
Financial Accounting
Accounting
ISBN:9781337272124
Author:Carl Warren, James M. Reeve, Jonathan Duchac
Publisher:Cengage Learning
Managerial Accounting: The Cornerstone of Busines...
Accounting
ISBN:9781337115773
Author:Maryanne M. Mowen, Don R. Hansen, Dan L. Heitger
Publisher:Cengage Learning
Principles of Accounting Volume 1
Accounting
ISBN:9781947172685
Author:OpenStax
Publisher:OpenStax College
Chapter 6 Merchandise Inventory; Author: Vicki Stewart;https://www.youtube.com/watch?v=DnrcQLD2yKU;License: Standard YouTube License, CC-BY
Accounting for Merchandising Operations Recording Purchases of Merchandise; Author: Socrat Ghadban;https://www.youtube.com/watch?v=iQp5UoYpG20;License: Standard Youtube License