
Economics:
10th Edition
ISBN: 9781285859460
Author: BOYES, William
Publisher: Cengage Learning
expand_more
expand_more
format_list_bulleted
Question
Chapter 10, Problem 15E
To determine
Use the information in the following table:
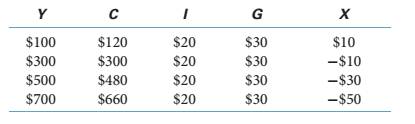
What are the equations for the consumption, net exports and aggregate expenditures functions?
Expert Solution & Answer
Want to see the full answer?
Check out a sample textbook solution
Students have asked these similar questions
What are the equations for the consumption, net exports, and aggregate expenditures functions?
What is the definition for the multiplier process
Suppose the following table shows the components of aggregate expenditure for an economy when disposable income is $200 billion and when it is $400 billion:
Disposable Income
$200 billion
$400 billion
Consumption
$300 billion
$400 billion
Investment
$100 billion
$100 billion
Government Purchases
$175 billion
$175 billion
Net Exports
$200 billion
$180 billion
Aggregate Expenditure
$775 billion
$855 billion
On the following graph, use the blue curve to plot government purchases as a function of disposable income:
Knowledge Booster

Similar questions
- Consider the hypothetical country of Kejimkujik. Suppose that national income in Kejimkujik is $300 billion, households pay $100 billion in taxes, household consumption is equal to $160 billion, and the marginal propensity to consume (MPC) is 0.6. On the following graph, use the blue line (circle symbol) to plot the economy's consumption function. Consumption Function050100150200250300350400450500500450400350300250200150100500CONSUMPTION (Billions of dollars)DISPOSABLE INCOME (Billions of dollars) Suppose now that Kejimkujik’s national income increases to $330 billion. Assuming the amount paid in taxes is fixed at $100 billion and that MPC = 0.6, what is the new amount of household consumption? $148 billion $219.4 billion $220.6 billion $178 billionarrow_forwardConsider an economy described by the following equations. Y= C + I + GC= 100 + .75 (Y - T)I= 500 - 50rG= 125T= 100 Where: Y is GDP, C is consumption, I is investment, G is government spending, T is taxes and r is the rate of interest. Answer the questions based on the following equations above. a. What is the value of the multiplier? b. What is the equilibrium equation for Y? Show your solution. c. Suppose the Central Bank policy is to adjust the money supply to maintain the interest rate at 4 percent, so r=4. What is the value of output? Show your solution. d. Assuming that no change in fiscal policy, what is the effect of a reduction in interest rate from 4 percent to 3 percent on equilibrium output. Show your solution. e. In this case, explain the policy that was used by the policymaker to target the aggregate demand.arrow_forwardOn the following graph, use the blue line (circle symbol) to plot this economy's consumption function based on these data. ? CONSUMPTION (Billions of dollars) 700 600 500 400 300 200 100 0 -100 0 100 200 300 400 500 600 DISPOSABLE INCOME (Billions of dollars) 700 800 From the preceding data, you know that the level of savings in the economy last year was $ economy is billion and the marginal propensity to save in this Suppose that this year, disposable income is projected to be $500 billion. Based on your analysis, you would expect consumption to be $ billion and savings to be $ billion.arrow_forward
- Construct a consumption function from the data given here and determine the MPC. Given the consumption function in the above question, what is the relationship between disposable income and consumption? Is it direct or indirect and then explain what it means.arrow_forwardBelow is some data for a hypothetical economy: C = -232 + 0.8Y XN = 107 - 0.1Y I = 100 T = 340 G = 340 Refer to the information above to answer this question What is the equation for aggregate expenditures? a. AE = 547 + 0.9Y b. AE = 315 + 0.7Y c. AE = 440 + 0.9Y d. AE = 440 + 0.7Yarrow_forwardSuppose the United States economy is represented by the following equations: Z = C + I + G C = 500 + .5YD T = 600 I = 300 YD = Y - T G = 2000 Given the above variables, calculate the equilibrium level of output. Now, assume that government spending decreases from 2000 to 1900. What is the new equilibrium level of output? How much does income change as a result of this event? What is the multiplier for this economy?arrow_forward
- Assume the following model of the expenditure sector: S=C+I+G+Nx TR=100 C=420+(4/5)YD I=160 G=180 Nx=-40 YD=Y+TR-TA TA=(1/6)Y If the government would like to increase the equilibrium level of output (Y) to the full employment level Y*=2,700, by how much should government purchases (G) be changed?arrow_forwardQuestion #2. 13 On April 27, 2023, the U.S. Bureau of Economic Analysis (BEA) released the data on GDP growth for the US economy for the first quarter of 2023 and revealed that the economy grew sluggisly by only 1.1 percent. Based on this report, suppose the U.S. consumers and businesses start to become pessimistic about the direction of the economy and eventually cut consumer and business spending, analyze using the IS-LM and AD-AS frameworks the short and long-run h effects of such a shock on prices, output, and real interest rate. # 3 E $ 4 Q Search R 15 % 5 f6 E L 6 17 4+ lyje Y 18 7 90 * 19 Page of 2 9 O f 112arrow_forwardUse the graph to answer the following questions: a)what is the value of the MPC? b)what is the value of the MPS?arrow_forward
- This question has four parts, here is the fourth and final part. 1.4. Create a graph for the aggregate expenditures (AE) model in Excel using the data from Table 1: A Private Closed Economy. (table 1 is in the attachment) tips: Remember, the 45degree line (also known as the Keynesian Cross) is a tool that shows how differences in aggregate expenditures and real GDP can affect business inventories which will affect future levels of real GDP. Aggregate expenditure and GDP are both function of consumption, investment, government spending, and net exports. So, the equations for the two are identical: Y = C + I + G + NX, and AE (aggregate expenditure) = C + I + G + NX For private closed economy the equation is: Y = C + I , and AE (aggregate expenditure) = C + Iarrow_forwardUse the following table. which represents the aggregate consumption function? Table: Individual and Aggregate Consumption Functions Current Consumer Spending Andy Fred Mark Disposable Income SO 1,000 $150 $100 $200 950 800 1,100 C = 450 + 0.7YD C = 150 + 0.9YD C= 250 + 0.8YD C = 450 + 0.8YDarrow_forwardUse the following graphs to answer the next question. 12 0 $75 150 225 Investment ($) Price Level 0 AS 0 Q₁ Real GDP Investment Demand $50 100 150 Investment ($) AD, ($50) increase the discount rate AD, (=$150) AD, (=$100) In the graphs, the numbers in parentheses near the AD1, AD2, and AD3 labels indicate the levels of investment spending associated with each curve. All figures are in billions. A shift in the aggregate demand curve from AD3 to AD₂ can be achieved by Federal Reserve action to buy government securities in the open market increase the reserve requirement Osell government securities in the open marketarrow_forward
arrow_back_ios
SEE MORE QUESTIONS
arrow_forward_ios
Recommended textbooks for you

 Economics (MindTap Course List)EconomicsISBN:9781337617383Author:Roger A. ArnoldPublisher:Cengage Learning
Economics (MindTap Course List)
Economics
ISBN:9781337617383
Author:Roger A. Arnold
Publisher:Cengage Learning