
Economics:
10th Edition
ISBN: 9781285859460
Author: BOYES, William
Publisher: Cengage Learning
expand_more
expand_more
format_list_bulleted
Question
Chapter 10, Problem 10E
To determine
Use the information in the following table:
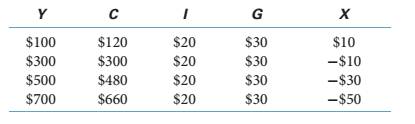
What is the MPS?
Expert Solution & Answer
Want to see the full answer?
Check out a sample textbook solution
Students have asked these similar questions
draw a AD/ AS diagram to show the effect of raising and increasing intrest, icome tax, corporate tax and government expenditure versus decreasing intrest, income tax, corporate tax and government expenditure.
MPS is 0.48
Calculate MPC
Describe the volatility of government spending and net exports relative to that of GDP and suggest an explanation for the patterns you observe in the graph.
Knowledge Booster

Similar questions
- What is the definition for the multiplier processarrow_forwardProvide an analysis for the below graph that I generated for the following question. What is the effect of an increase in the Treasury bill rate rising from 7% to 8%, and the government bonds rate from 9% to 11%? Plot the trajectory of GDP, and discuss it.The discussion should not be less than two paragraphs. For your simulation: simulate the model for the period 1900-2000, and shock the interest rates in 1930. The plot should present the trajectory of the GDP from the original steady state (with interest rates 7% and 9%) to the new one. find the trajectory below.arrow_forwardECN201_N40_SP24: Workshee X bads/Worksheet%205-%20AS%20and%20AD%20(2).pdf P Worksheet 5: Aggregate Supply and Aggregate Demand Name: Complete the questions below. Be sure to show your work. Upload this worksheet to Moodle. Consider the following Aggregate Supply and Aggregate Demand curves. 10 8 6 Microsoft word 4 2 1 / 1 | - 100% + 20 40 1. What is the ACTUAL level of GDP? AS/AD 2. What is the equilibrium price level? m LRAS 60 80 SRAS AD 100 120 GDP tvilli A ALarrow_forward
- Question #2. 13 On April 27, 2023, the U.S. Bureau of Economic Analysis (BEA) released the data on GDP growth for the US economy for the first quarter of 2023 and revealed that the economy grew sluggisly by only 1.1 percent. Based on this report, suppose the U.S. consumers and businesses start to become pessimistic about the direction of the economy and eventually cut consumer and business spending, analyze using the IS-LM and AD-AS frameworks the short and long-run h effects of such a shock on prices, output, and real interest rate. # 3 E $ 4 Q Search R 15 % 5 f6 E L 6 17 4+ lyje Y 18 7 90 * 19 Page of 2 9 O f 112arrow_forwardThe following graph shows the aggregate demand (AD) and aggregate supply (AS) curves for the United States in 1941. Shift one of the curves on the following graph to illustrate the effect of increased U.S. government spending during World War II.arrow_forwardThe aggregate demand function: yad =C+1+G₁ = 500+ 0.75Y is plotted on the graph to the right. The graph also shows the 45° line where aggregate output Y equals aggregate demand yad for all points. What happens to aggregate output if government spending rises by 100? The equilibrium level of output rises by $ billion. (Round your response to the nearest billion.) Consumption Expenditure, C ($ billions) 3000- 2800- 2600- 2400- 2200- 2000- 1800- 1600- 1400- 1200- 1000- 800- 600- 400- 200- 0- 0 yad =C+I+G₁ = 500 +0.75Y Y = yad 45° 400 800 1200 1600 2000 2400 2800 Disposable Income ($ billions)arrow_forward
arrow_back_ios
SEE MORE QUESTIONS
arrow_forward_ios
Recommended textbooks for you

 Principles of Economics 2eEconomicsISBN:9781947172364Author:Steven A. Greenlaw; David ShapiroPublisher:OpenStax
Principles of Economics 2e
Economics
ISBN:9781947172364
Author:Steven A. Greenlaw; David Shapiro
Publisher:OpenStax