
Videos
Value Chain Analysis and Financial Statement Relations. Exhibit 1.25 (page 68) presents common-size income statements and balance sheets for seven firms that operate at various stages in the value chain for the pharmaceutical industry. These common-size statements express all amounts as a percentage of sales revenue. Exhibit 1.25 also shows the cash flow from operations to capital expenditures ratios for each firm. A dash for a particular financial statement item does not necessarily mean the amount is zero. It merely indicates that the amount is not sufficiently large for the firm to disclose it. A list of the seven companies and a brief description of their activities follow.
- A. Wyeth: Engages in the development, manufacture, and sale of ethical drugs (that is, drugs requiring a prescription). Wyeth’s drugs represent primarily mixtures of chemical compounds. Ethical-drug companies must obtain approval of new drugs from the U.S. Food and Drug Administration (FDA). Patents protect such drugs from competition until other drug companies develop more effective substitutes or the patent expires.
- B. Amgen: Engages in the development, manufacture, and sale of drugs based on biotechnology research. Biotechnology drugs must obtain approval from the FDA and enjoy patent protection similar to that for chemical-based drugs. The biotechnology segment is less mature than the ethical-drug industry, with relatively few products having received FDA approval.
- C. Mylan Laboratories: Engages in the development, manufacture, and sale of generic drugs. Generic drugs have the same chemical compositions as drugs that had previously benefited from patent protection but for which the patent has expired. Generic-drug companies have benefited in recent years from the patent expiration of several major ethical drugs. However, the major ethical-drug companies have increasingly offered generic versions of their ethical drugs to compete against the generic-drug companies.
- D. Johnson & Johnson: Engages in the development, manufacture, and sale of over-thecounter health care products. Such products do not require a prescription and often benefit from brand recognition.
- E. Covance: Offers product development and laboratory testing services for biotechnology and pharmaceutical drugs. It also offers commercialization
services and market access services. Cost of goods sold for this company represents the salaries of personnel conducting the laboratory testing and drug approval services. - F. Cardinal Health: Distributes drugs as a wholesaler to drugstores, hospitals, and mass erchandisers. Also offers pharmaceutical benefit management services in which it provides customized databases designed to help customers order more efficiently, contain costs, and monitor their purchases. Cost of goods sold for Cardinal Health includes the cost of drugs sold plus the salaries of personnel providing pharmaceutical benefit management services.
- G. Walgreens: Operates a chain of drugstores nationwide. The data in Exhibit 1.25 for Walgreens include the recognition of operating lease commitments for retail space.
REQUIRED
Use the ratios to match the companies in Exhibit 1.25 with the firms listed above.

Trending nowThis is a popular solution!

Chapter 1 Solutions
Financial Reporting, Financial Statement Analysis and Valuation


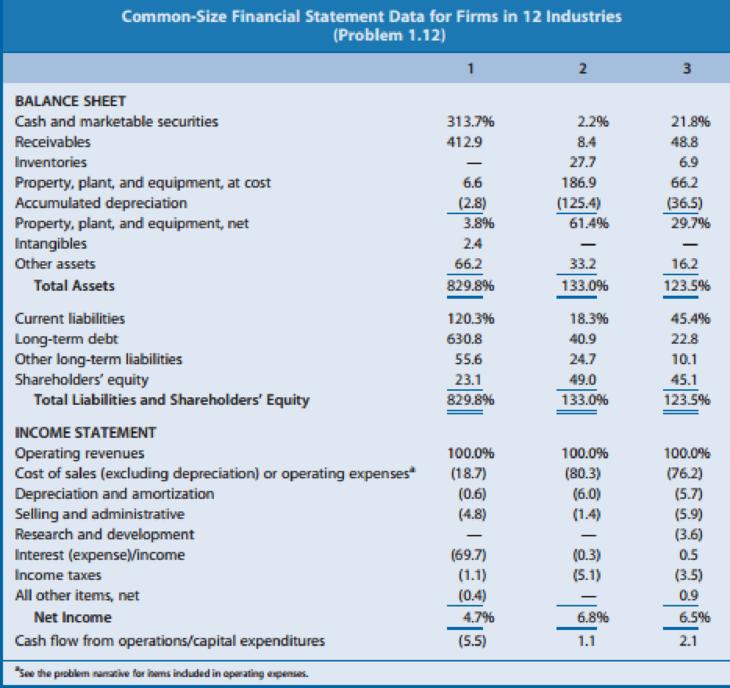
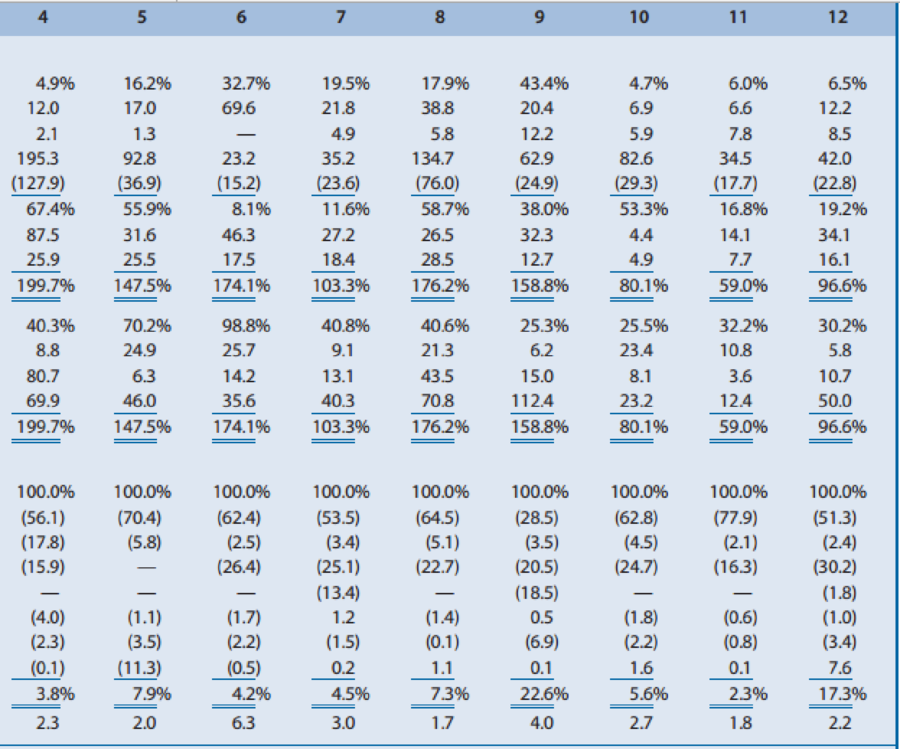
- Effect of Industry Characteristics on Financial Statement Relations. Effective financial statement analysis requires an understanding of a firms economic characteristics. The relations between various financial statement items provide evidence of many of these economic characteristics. Exhibit 1.22 (pages 6061) presents common-size condensed balance sheets and income statements for 12 firms in different industries. These common-size balance sheets and income statements express various items as a percentage of operating revenues. (That is, the statement divides all amounts by operating revenues for the year.) Exhibit 1.22 also shows the ratio of cash flow from operations to capital expenditures. A dash for a particular financial statement item does not necessarily mean the amount is zero. It merely indicates that the amount is not sufficiently large enough for the firm to disclose it. Amounts that are not meaningful are shown as n.m. A list of the 12 companies and a brief description of their activities follow. A. Amazon.com: Operates websites to sell a wide variety of products online. The firm operated at a net loss in all years prior to that reported in Exhibit 1.22. B. Carnival Corporation: Owns and operates cruise ships. C. Cisco Systems: Manufactures and sells computer networking and communications products. D. Citigroup: Offers a wide range of financial services in the commercial banking, insurance, and securities business. Operating expenses represent the compensation of employees. E. eBay: Operates an online trading platform for buyers to purchase and sellers to sell a variety of goods. The firm has grown in part by acquiring other companies to enhance or support its online trading platform. F. Goldman Sachs: Offers brokerage and investment banking services. Operating expenses represent the compensation of employees. G. Johnson Johnson: Develops, manufactures, and sells pharmaceutical products, medical equipment, and branded over-the-counter consumer personal care products. H. Kelloggs: Manufactures and distributes cereal and other food products. The firm acquired other branded food companies in recent years. I. MGM Mirage: Owns and operates hotels, casinos, and golf courses. J. Molson Coors: Manufactures and distributes beer. Molson Coors has made minority ownership investments in other beer manufacturers in recent years. K. Verizon: Maintains a telecommunications network and offers telecommunications services. Operating expenses represent the compensation of employees. Verizon has made minority investments in other cellular and wireless providers. L. Yum! Brands: Operates chains of name-brand restaurants, including Taco Bell, KFC, and Pizza Hut. REQUIRED Use the ratios to match the companies in Exhibit 1.22 with the firms listed above.arrow_forwardEffect of Industry Characteristics on Financial Statement Relations. Effective financial statement analysis requires an understanding of a firms economic characteristics. The relations between various financial statement items provide evidence of many of these economic characteristics. Exhibit 1.23 (pages 6263) presents common-size condensed balance sheets and income statements for 12 firms in different industries. These common-size balance sheets and income statements express various items as a percentage of operating revenues. (That is, the statement divides all amounts by operating revenues for the year.) Exhibit 1.23 also shows the ratio of cash flow from operations to capital expenditures. A dash for a particular financial statement item does not necessarily mean the amount is zero. It merely indicates that the amount is not sufficiently large for the firm to disclose it. A list of the 12 companies and a brief description of their activities follow. A. Abercrombie Fitch: Sells retail apparel primarily through stores to the fashionconscious young adult and has established itself as a trendy, popular player in the specialty retailing apparel industry. B. Allstate Insurance: Sells property and casualty insurance, primarily on buildings and automobiles. Operating revenues include insurance premiums from customers and revenues earned from investments made with cash received from customers before Allstate pays customers claims. Operating expenses include amounts actually paid or expected to be paid in the future on insurance coverage outstanding during the year. C. Best Buy: Operates a chain of retail stores selling consumer electronic and entertainment equipment at competitively low prices. D. E. I. du Pont de Nemours: Manufactures chemical and electronics products. E. Hewlett-Packard: Develops, manufactures, and sells computer hardware. The firm outsources manufacturing of many of its computer components. F. HSBC Finance: Lends money to consumers for periods ranging from several months to several years. Operating expenses include provisions for estimated uncollectible loans (bad debts expense). G. Kelly Services: Provides temporary office services to businesses and other firms. Operating revenues represent amounts billed to customers for temporary help services, and operating expenses include amounts paid to the temporary help employees of Kelly. H. McDonalds: Operates fast-food restaurants worldwide. A large percentage of McDonalds restaurants are owned and operated by franchisees. McDonalds frequently owns the restaurant buildings of franchisees and leases them to franchisees under long-term leases. I. Merck: A leading research-driven pharmaceutical products and services company. Merck discovers, develops, manufactures, and markets a broad range of products to improve human and animal health directly and through its joint ventures. J. Omnicom Group: Creates advertising copy for clients and is the largest marketing services firm in the world. Omnicom purchases advertising time and space from various media and sells it to clients. Operating revenues represent commissions and fees earned by creating advertising copy and selling media time and space. Operating expenses includes employee compensation. K. Pacific Gas Electric: Generates and sells power to customers in the western United States. L. Procter Gamble: Manufactures and markets a broad line of branded consumer products. REQUIRED Use the ratios to match the companies in Exhibit 1.23 with the firms listed above.arrow_forwardCarson Electronics’ management has long viewed BGT Electronics as an industry leader and uses this firm as a model firm for analyzing its own performance. The balance sheet and income statements for the two firms are as follows: Calculate the following ratios for both Carson and BGT: a) Debt ratio: b) Average collection period: c) Fixed asset turnover: d) Return on equity:arrow_forward
- The income statement, also known as the profit and loss (P&L) statement, provides a snapshot of the financial performance of a company during a specified period of time. It reports a firm’s gross income, expenses, net income, and the income that is available for distribution to its preferred and common shareholders. The income statement is prepared using the generally accepted accounting principles (GAAP) that match the firm’s revenues and expenses to the period in which they were incurred, not necessarily when cash was received or paid. Investors and analysts use the information given in the income statement and other financial statements and reports to evaluate the company’s financial performance and condition. Consider the following scenario: Cute Camel Woodcraft Company’s income statement reports data for its first year of operation. The firm’s CEO would like sales to increase by 25% next year. 1. Cute Camel is able to achieve this level of increased sales, but its…arrow_forwardThe income statement, also known as the profit and loss (P&L) statement, provides a snapshot of the financial performance of a company during a specified period of time. It reports a firm's gross income, expenses, net income, and the income that is available for distribution to its preferred and common shareholders. The income statement is prepared using the generally accepted accounting principles (GAAP) that match the firm's revenues and expenses to the period in which they were incurred, not necessarily when cash was received or paid Investors and analysts use the information given in the income statement and other financial statements and reports to evaluate the company's financial performance and condition. Consider the following scenario: Cold Goose Metal Works Inc.'s income statement reports data for its first year of operation. The firm's CEO would like sales to increase by 25% next year. 1. Cold Goose is able achieve this level of increased sales, but its interast costs…arrow_forwardOne of the most important applications of ratio analysis is to compare a company’s performance with that of other players in the industry or to compare its own performance over a period of time. Such analyses are referred to as a comparative analysis and trend analysis, respectively. A common size analysis requires the representation of financial statement data relative to a single financial statement item (or base account or value). What is the most commonly used base item for a common size balance sheet? A. Earnings before interest and taxes B. Total assets C. Net sales D. Net income Suppose you are conducting an analysis of the financial performance of Blue Hamster Manufacturing Inc. over the past three years. The company did not issue new shares during these three years and has faced some operational difficulties. The company has thus pilot tested some new forecasting strategies for better operations management. You have collected the company’s…arrow_forward
- Which of the following statements regarding the income statement is true?a. The income statement provides information about the profitability and growth of a company.b. The income statement shows the results of a company’s operations at a specific point in time.c. The income statement consists of assets, expenses, liabilities, and revenues.d. Typical income statement accounts include sales revenue, unearned revenue, and cost of goods sold.arrow_forwardIdentify which of the following six metrics a through f best completes questions 1 through 3 below. a. Days’ sales uncollected d. Return on total assets b. Accounts receivable turnover e. Total asset turnover c. Working capital f. Profit margin 1. Which two ratios are key components in measuring a company’s operating efficiency? Which ratio summarizes these two components? 2. What measure reflects the difference between current assets and current liabilities? 3. Which two short-term liquidity ratios measure how frequently a company collects its accounts?arrow_forwardOne of the most important applications of ratio analysis is to compare a company’s performance with that of other players in the industry or to compare its own performance over a period of time. Such analyses are referred to as a comparative analysis and trend analysis, respectively. A) A common size analysis requires the representation of financial statement data relative to a single financial statement item (or base account or value). What is the most commonly used base item for a common size balance sheet? Net income Earnings before interest and taxes Total assets Net sales Suppose you are conducting an analysis of the financial performance of Blue Hamster Manufacturing Inc. over the past three years. The company did not issue new shares during these three years and has faced some operational difficulties. The company has thus pilot tested some new forecasting strategies for better operations management. You have collected the company’s relevant…arrow_forward
- Below are the two basic financial statements of Chiz Trading Company. You are tasked to prepare an analysis using Horizontal and Vertical Analysis of their two-dated financial statements. In addition to this you have been tasked to prepare financial ratios measuring the company’s: Liquidity Status Current Ratios Quick Asset Ratios Efficiency Status Asset Turnover Fixed Asset Turnover Inventory Turnover Days in Inventory Accounts Receivable Turnover Days in Receivable Profitability Status: Gross Profit margin Ratio Operating Income Ratio Net Profit Ratio Return on Assets Return on Equityarrow_forwardWhich of the following statements is correct? a. Any forecast of financial requirements involves determining how much money the firm will need and is obtained by adding together increases in assets and spontaneous liabilities and subtracting operating income. b. The percentage of sales method of forecasting financial needs requires only a forecast of the firm's balance sheet. Although a forecasted income statement helps clarify the need, it is not essential to the percentage of sales method. c. Because dividends are paid after taxes from retained earnings, dividends are not included in the percentage of sales method of forecasting. d. Financing feedbacks describe the fact that interest must be paid on the debt used to help finance AFN and dividends must be paid on the shares issued to raise the equity part of the AFN. These payments would lower the net income and retained earnings shown in the projected financial statements. e. All of the statements above are false.arrow_forwardWhich statement best describes a financial ratio and financial ratio analysis? A financial ratio simply represents a relationship between 2 or more pieces of financial information; there is one absolute, standard list of ratios that applies to all financial analysis A financial ratio simply represents a relationship between 2 or more pieces of financial information; there is NOT one absolute, standard list of ratios that applies to all financial analysis A financial ratio simply represents a market estimate of a certain aspect of a firm's financial position and the industry's benchmark; there is one absolute, standard list of ratios that applies to all financial analysis A financial ratio simply represents a market estimate of a certain aspect of a firm's financial position and the industry's benchmark; there is NOT one absolute, standard list of ratios that applies to all financial analysisarrow_forward
 Financial Reporting, Financial Statement Analysis...FinanceISBN:9781285190907Author:James M. Wahlen, Stephen P. Baginski, Mark BradshawPublisher:Cengage Learning
 Financial Accounting: The Impact on Decision Make...AccountingISBN:9781305654174Author:Gary A. Porter, Curtis L. NortonPublisher:Cengage Learning
 Cornerstones of Financial AccountingAccountingISBN:9781337690881Author:Jay Rich, Jeff JonesPublisher:Cengage Learning
 Financial AccountingAccountingISBN:9781337272124Author:Carl Warren, James M. Reeve, Jonathan DuchacPublisher:Cengage LearningPrinciples of Accounting Volume 1AccountingISBN:9781947172685Author:OpenStaxPublisher:OpenStax College