Nike: Somewhere between a Swoosh and a Slam Dunk
Nike, Inc.’s principal business activity involves the design, development, and worldwide marketing of high-quality footwear, apparel, equipment, and accessory products for serious and recreational athletes. Almost 25,000 employees work for the firm as of 2009. Nike boasts the largest worldwide market share in the athletic footwear industry and a leading market share in sports and athletic apparel.
This case uses Nike’s financial statements and excerpts from its notes to review important concepts underlying the three principal financial statements (
Industry Economics
Product Lines
Industry analysts debate whether the athletic footwear and apparel industry is a performancedriven industry or a fashion-driven industry. Proponents of the performance view point to Nike’s dominant market position, which results in part from continual innovation in product development. Proponents of the fashion view point to the difficulty of protecting technological improvements from competitor imitation, the large portion of total expenses comprising advertising, the role of sports and other personalities in promoting athletic shoes, and the fact that a high percentage of athletic footwear and apparel consumers use the products for casual wear rather than the intended athletic purposes (such as playing basketball or running).
Growth
There are only modest growth opportunities for footwear and apparel in the United States. Concern exists with respect to volume increases (how many pairs of athletic shoes will consumers tolerate in their closets) and price increases (will consumers continue to pay prices for innovative athletic footwear that is often twice as costly as other footwear).
Athletic footwear companies have diversified their revenue sources in two directions in recent years. One direction involves increased emphasis on international sales. With dress codes becoming more casual in Europe and East Asia and interest in American sports such as basketball becoming more widespread, industry analysts view international markets as the major growth markets during the next several years. Increased emphasis on soccer (European football) in the United States aids companies such as Adidas that have reputations for quality soccer footwear.
The second direction for diversification is sports and athletic apparel. The three leading athletic footwear companies capitalize on their brand name recognition and distribution channels to create a line of sportswear that coordinates with their footwear. Team uniforms and matching apparel for coaching staffs and fans have become a major growth avenue. For example, to complement Nike’s footwear sales, Nike acquired Umbro, a major brand-name line of jerseys, shorts, jackets, and other apparel in the soccer market.
Production
Essentially all athletic footwear and most apparel are produced in factories in Asia, primarily China (40%), Indonesia (31%), Vietnam, South Korea, Taiwan, and Thailand. The footwear companies do not own any of these manufacturing facilities. They typically hire manufacturing representatives to source and oversee the manufacturing process, helping to ensure quality control and serving as a link between the design and the manufacture of products. The manufacturing process is labor-intensive, with sewing machines used as the primary equipment. Footwear companies typically price their purchases from these factories in U.S. dollars.
Marketing
Athletic footwear and sportswear companies sell their products to consumers through various independent department, specialty, and discount stores. Their sales forces educate retailers on new product innovations, store display design, and similar activities. The market shares of Nike and the other major brand-name producers dominate retailers’ shelf space, and slower growth in sales makes it increasingly difficult for the remaining athletic footwear companies to gain market share. The slower growth also has led the major companies to increase significantly their advertising and payments for celebrity endorsements. Many footwear companies, including Nike, have opened their own retail stores, as well as factory outlet stores for discounted sales of excess inventory.
Athletic footwear and sportswear companies have typically used independent distributors to market their products in other countries. With increasing brand recognition and anticipated growth in international sales, these companies have recently acquired an increasing number of their distributors to capture more of the profits generated in other countries and maintain better control of international marketing.
Financing
Compared to other apparel firms, the athletic footwear firms generate higher profit margins and
Nike Strategy
Nike targets the serious athlete with performance-driven footwear and athletic wear, as well as the recreational athlete. The firm has steadily expanded the scope of its product portfolio from its primary products of high-quality athletic footwear for running, training, basketball, soccer, and casual wear to encompass related product lines such as sports apparel, bags, equipment, balls, eyewear, timepieces, and other athletic accessories. In addition, Nike has expanded its scope of sports, now offering products for swimming, baseball, cheerleading, football, golf, lacrosse, tennis, volleyball, skateboarding, and other leisure activities. In recent years, the firm has emphasized growth outside the United States. Nike also has grown by acquiring other apparel companies, including Cole Haan (dress and casual footwear), Converse (athletic and casual footwear and apparel), Hurley (apparel for action sports such as surfing, skateboarding, and snowboarding), and Umbro (footwear, apparel, and equipment for soccer). The firm sums up the company’s philosophy and driving force behind its success as follows:
Nike designs, develops, and markets high quality footwear, apparel, equipment and accessory products worldwide. We are the largest seller of athletic footwear and apparel in the world. Our strategy is to achieve long-term revenue growth by creating innovative, “must-have” products; building deep, personal consumer connections with our brands; and delivering compelling retail presentation and experiences.
To maintain its technological edge, Nike engages in extensive research at its research facilities in Beaverton, Oregon. It continually alters its product line to introduce new footwear, apparel, equipment, and evolutionary improvements in existing products.
Nike maintains a reputation for timely delivery of footwear products to its customers, primarily as a result of its “Futures” ordering program. Under this program, retailers book orders five to six months in advance. Nike guarantees delivery of the order within a set time period at the agreed price at the time of ordering. Approximately 89% of the U.S. footwear orders received by Nike during 2009 came through its Futures program. This program allows the company to improve production scheduling, thereby reducing inventory risk. However, the program locks in selling prices and increases Nike’s risk of increased raw materials and labor costs. Independent contractors manufacture virtually all of Nike’s products. Nike sources all of its footwear and approximately 95% of its apparel from other countries.
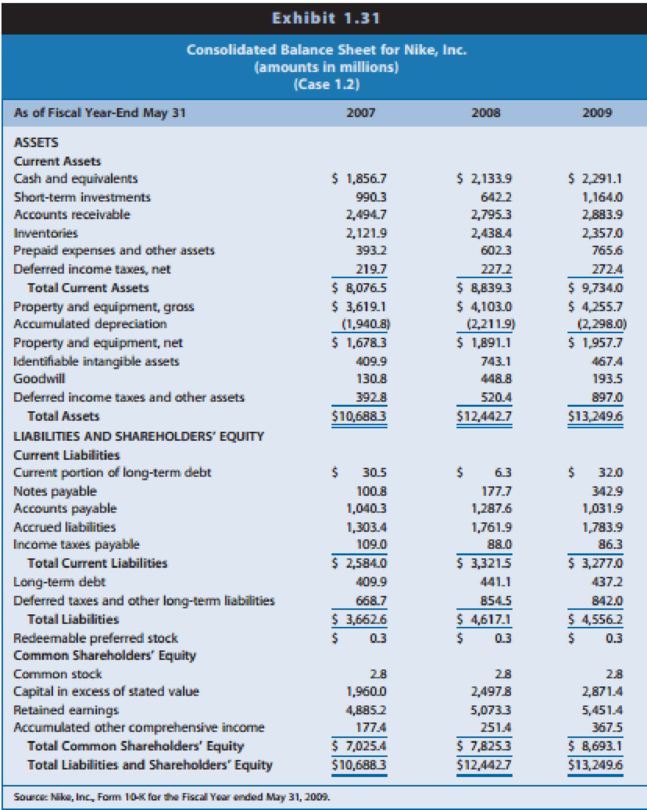
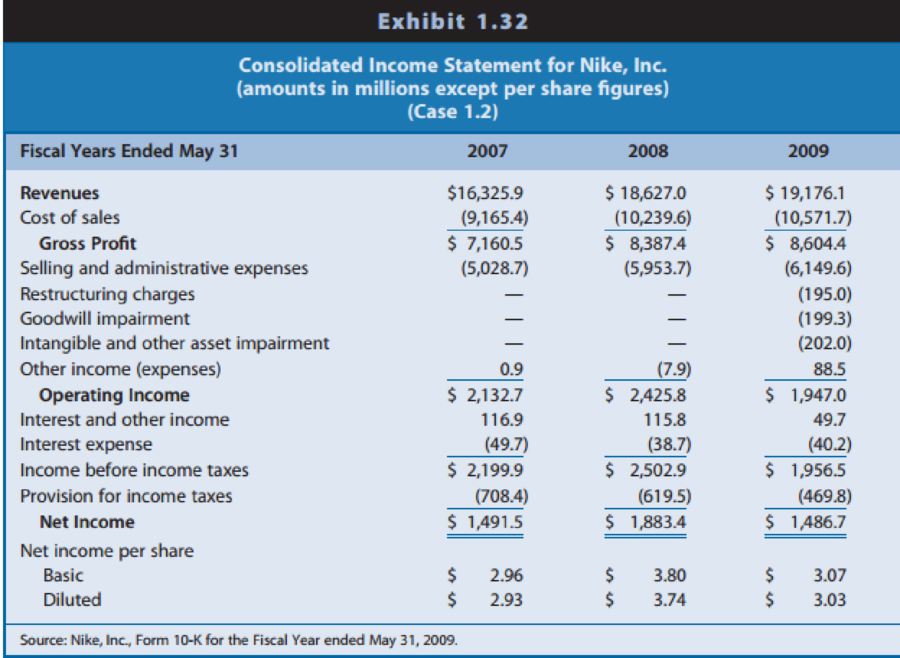
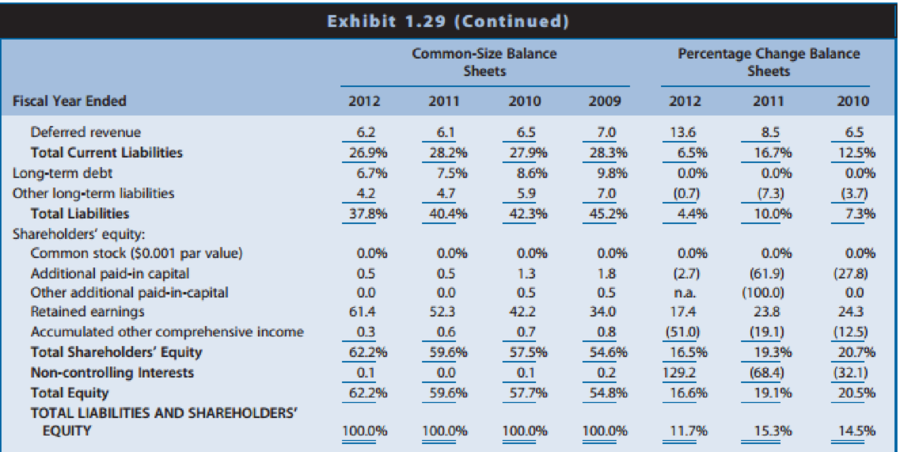
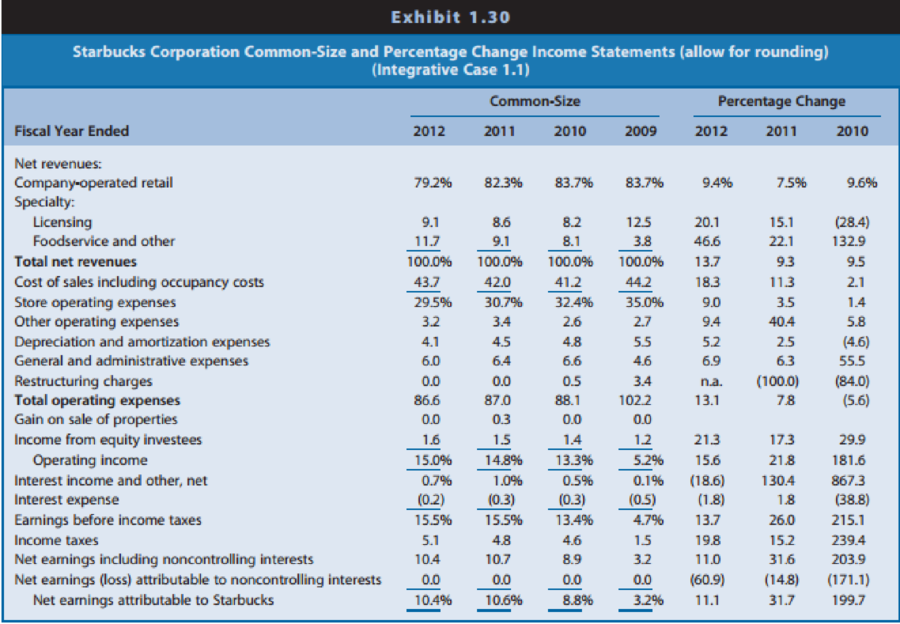
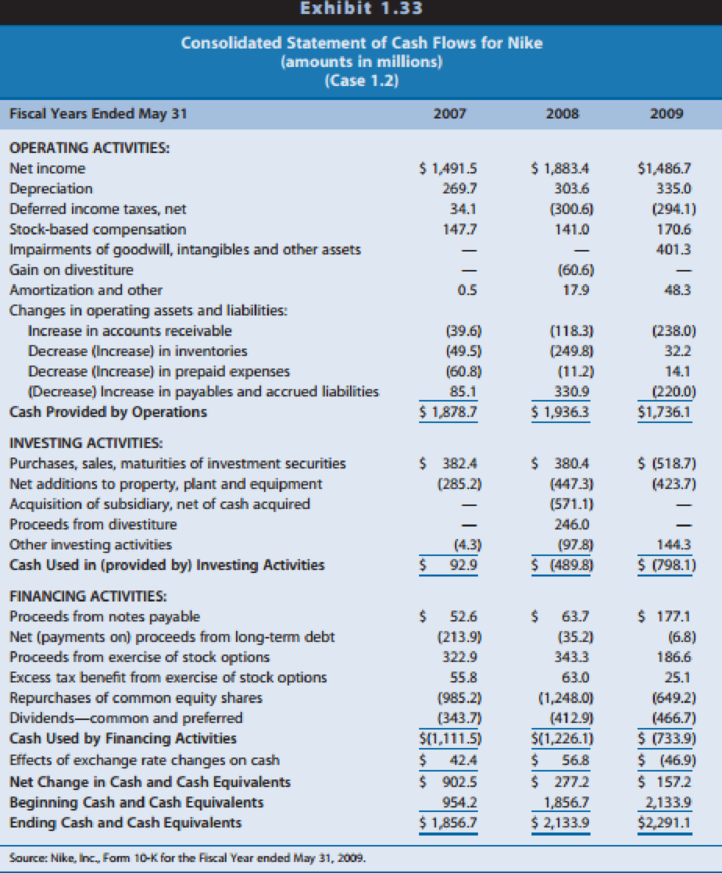
The following exhibits present information for Nike:
Exhibit 1.31: Consolidated balance sheets for 2007, 2008, and 2009
Exhibit 1.32: Consolidated income statements for 2007,2008, and 2009
Exhibit 1.33: Consolidated statements of cash flows 2007, 2008, and 2009
Exhibit 1.34: Excerpts from the notes to Nike’s financial statements
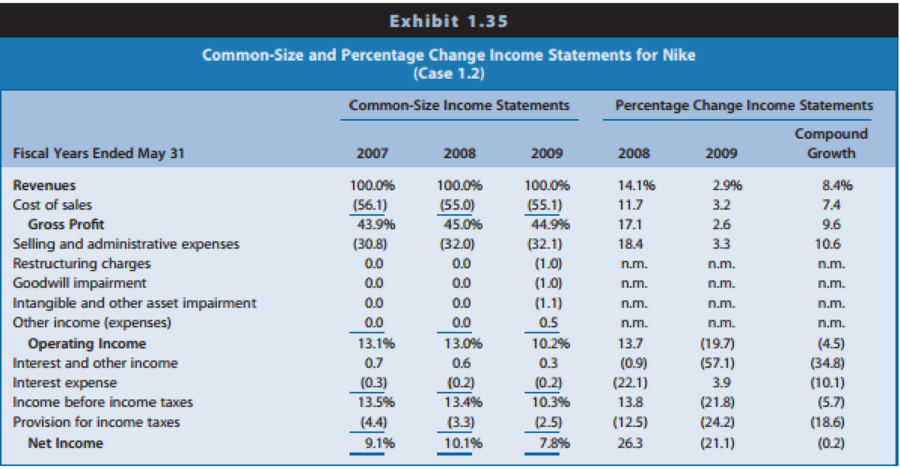
Exhibit 1.35: Common-size and percentage change income statements
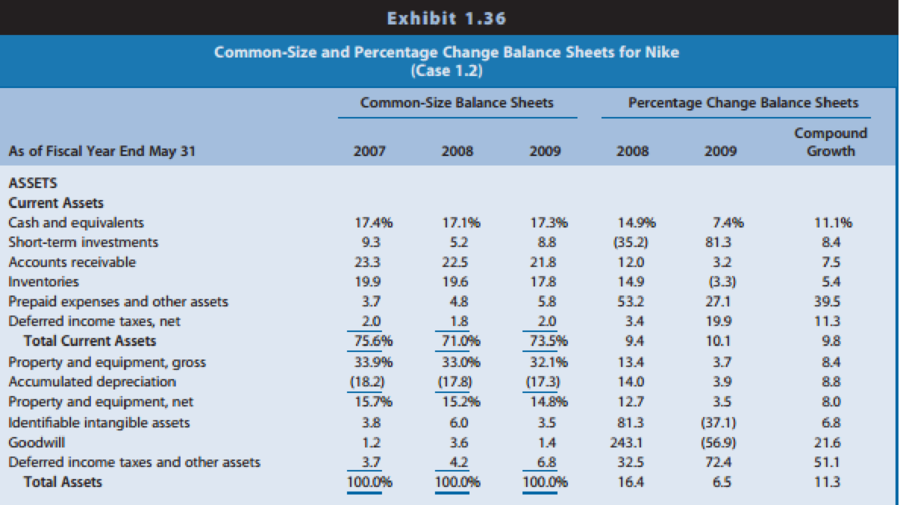
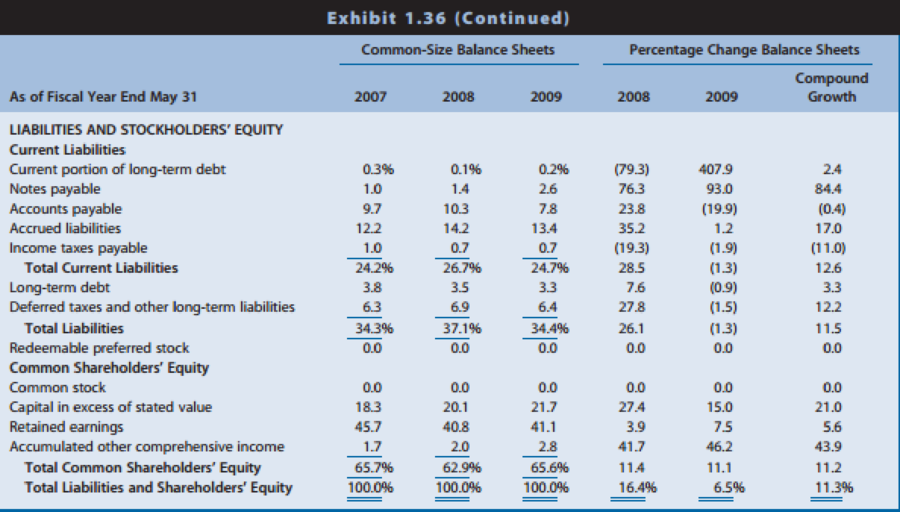
Exhibit 1.36: Common-size and percentage change balance sheets
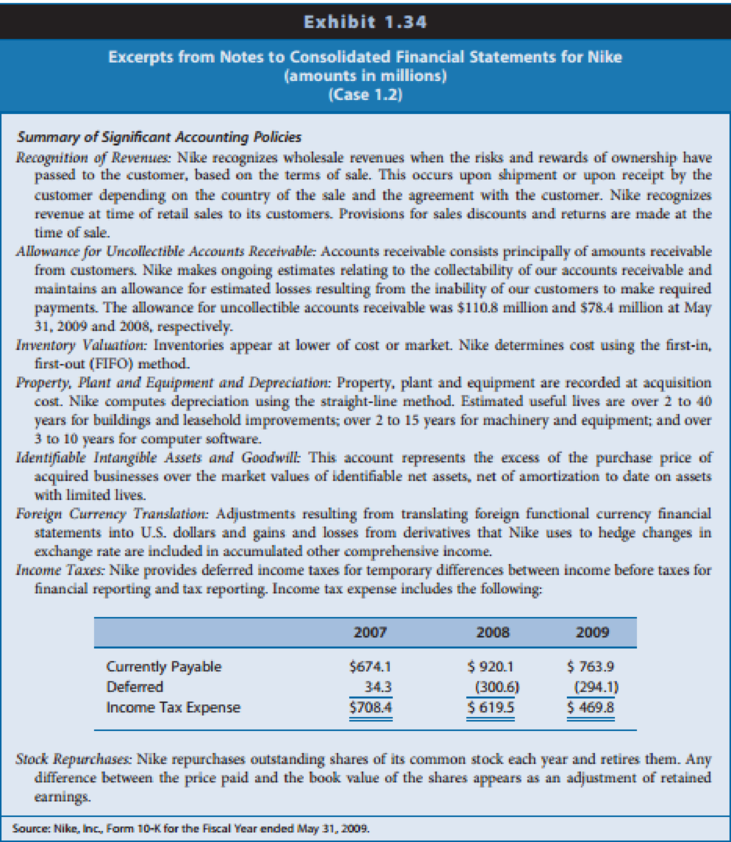
Identify the time at which Nike recognizes revenues. Does this timing of revenue recognition seem appropriate? Explain.
REQUIRED
Study the financial statements and notes for Nike and respond to the following questions.
What are the likely reasons for the repurchases of common stock during the three years?
Want to see the full answer?
Check out a sample textbook solution
Chapter 1 Solutions
Financial Reporting, Financial Statement Analysis and Valuation
- Larry Davis borrows $80,000 at 14 percent interest toward the purchase of a home. His mortgage is for 25 years. a. How much will his annual payments be? (Although home payments are usually on a monthly basis, we shall do our analysis on an annual basis for ease of computation. We will get a reasonably accurate answer.) b. How much interest will he pay over the life of the loan? c. How much should be willing to pay to get out of a 14 percent mortgage and into a 10 percent mortgage with 25 years remaining on the mortgage? Assume current interest rates are 10 percent. Carefully consider the time value of money. Disregard taxes.arrow_forwardYou are chairperson of the investment fund for the local closet. You are asked to set up a fund of semiannual payments to be compounded semiannually to accumulate a sum of $250,000 after nine years at a 10 percent annual rate (18 payments). The first payment into the fund is to take place six months from today, and the last payment is to take place at the end of the ninth year. Determine how much the semiannual payment should be. (a) On the day, after the sixth payment is made (the beginning of the fourth year), the interest rate goes up to a 12 percent annual rate, and you can earn a 12 percent annual rate on funds that have been accumulated as well as all future payments into the funds. Interest is to be compounded semiannually on all funds. Determine how much the revised semiannual payments should be after this rate change (there are 12 payments and compounding dates). The next payment will be in the middle of the fourth year.arrow_forwardIf your Uncle borrows $60,000 from the bank at 10 percent interest over the seven-year life of the loan, what equal annual payments must be made to discharge the loan, plus pay the bank its required rate of interest? How much of his first payment will be applied to interest? To principal? How much of his second payment will be applied to each?arrow_forward
- Q1: You are an analyst in charge of valuing common stocks. You have been asked to value two stocks. The first stock NEWER Inc. just paid a dividend of $6.00. The dividend is expected to increase by 60%, 45%, 30% and 15% per year, respectively, in the next four years. Thereafter, the dividend will increase by 4% per year in perpetuity. Calculate NEWER’s expected dividend for t = 1, 2, 3, 4 and 5.The required rate of return for NEWER stock is 14% compounded annually.What is NEWER’s stock price?The second stock is OLDER Inc. OLDER Inc. will pay its first dividend of $10.00 three (3) years from today. The dividend will increase by 30% per year for the following four (4) years after its first dividend payment. Thereafter, the dividend will increase by 3% per year in perpetuity. Calculate OLDER’s expected dividend for t = 1, 2, 3, 4, 5, 6, 7 and 8.The required rate of return for OLDER stock is 16% compounded annually.What is OLDER’s stock price?Now assume that both stocks have a required…arrow_forwardQ1: Blossom is 30 years old. She plans on retiring in 25 years, at the age of 55. She believes she will live until she is 105. In order to live comfortably, she needs a substantial retirement income. She wants to receive a weekly income of $5,000 during retirement. The payments will be made at the beginning of each week during her retirement. Also, Blossom has pledged to make an annual donation to her favorite charity during her retirement. The payments will be made at the end of each year. There will be a total of 50 annual payments to the charity. The first annual payment will be for $20,000. Blossom wants the annual payments to increase by 3% per year. The payments will end when she dies. In addition, she would like to establish a scholarship at Toronto Metropolitan University. The first payment would be $80,000 and would be made 3 years after she retires. Thereafter, the scholarship payments will be made every year. She wants the payments to continue after her death, therefore…arrow_forwardQ1: Blossom is 30 years old. She plans on retiring in 25 years, at the age of 55. She believes she will live until she is 105. In order to live comfortably, she needs a substantial retirement income. She wants to receive a weekly income of $5,000 during retirement. The payments will be made at the beginning of each week during her retirement. Also, Blossom has pledged to make an annual donation to her favorite charity during her retirement. The payments will be made at the end of each year. There will be a total of 50 annual payments to the charity. The first annual payment will be for $20,000. Blossom wants the annual payments to increase by 3% per year. The payments will end when she dies. In addition, she would like to establish a scholarship at Toronto Metropolitan University. The first payment would be $80,000 and would be made 3 years after she retires. Thereafter, the scholarship payments will be made every year. She wants the payments to continue after her death, therefore…arrow_forward
- Jerome Moore invests in a stock that will pay dividends of $2.00 at the end of the first year; $2.20 at the end of the second year; and $2.40 at the end of the third year. also, he believes that at the end of the third year he will be able to sell the stock for $33. what is the present value of all future benefits if a discount rate of 11 percent is applied?arrow_forwardQ1: You are an analyst in charge of valuing common stocks. You have been asked to value two stocks. The first stock NEWER Inc. just paid a dividend of $6.00. The dividend is expected to increase by 60%, 45%, 30% and 15% per year, respectively, in the next four years. Thereafter, the dividend will increase by 4% per year in perpetuity. Calculate NEWER’s expected dividend for t = 1, 2, 3, 4 and 5.The required rate of return for NEWER stock is 14% compounded annually.What is NEWER’s stock price?The second stock is OLDER Inc. OLDER Inc. will pay its first dividend of $10.00 three (3) years from today. The dividend will increase by 30% per year for the following four (4) years after its first dividend payment. Thereafter, the dividend will increase by 3% per year in perpetuity. Calculate OLDER’s expected dividend for t = 1, 2, 3, 4, 5, 6, 7 and 8.The required rate of return for OLDER stock is 16% compounded annually.What is OLDER’s stock price?Now assume that both stocks have a required…arrow_forwardQ1: You are an analyst in charge of valuing common stocks. You have been asked to value two stocks. The first stock NEWER Inc. just paid a dividend of $6.00. The dividend is expected to increase by 60%, 45%, 30% and 15% per year, respectively, in the next four years. Thereafter, the dividend will increase by 4% per year in perpetuity. Calculate NEWER’s expected dividend for t = 1, 2, 3, 4 and 5.The required rate of return for NEWER stock is 14% compounded annually.What is NEWER’s stock price?The second stock is OLDER Inc. OLDER Inc. will pay its first dividend of $10.00 three (3) years from today. The dividend will increase by 30% per year for the following four (4) years after its first dividend payment. Thereafter, the dividend will increase by 3% per year in perpetuity. Calculate OLDER’s expected dividend for t = 1, 2, 3, 4, 5, 6, 7 and 8.The required rate of return for OLDER stock is 16% compounded annually.What is OLDER’s stock price?Now assume that both stocks have a required…arrow_forward
- Q1: Blossom is 30 years old. She plans on retiring in 25 years, at the age of 55. She believes she will live until she is 105. In order to live comfortably, she needs a substantial retirement income. She wants to receive a weekly income of $5,000 during retirement. The payments will be made at the beginning of each week during her retirement. Also, Blossom has pledged to make an annual donation to her favorite charity during her retirement. The payments will be made at the end of each year. There will be a total of 50 annual payments to the charity. The first annual payment will be for $20,000. Blossom wants the annual payments to increase by 3% per year. The payments will end when she dies. In addition, she would like to establish a scholarship at Toronto Metropolitan University. The first payment would be $80,000 and would be made 3 years after she retires. Thereafter, the scholarship payments will be made every year. She wants the payments to continue after her death, therefore…arrow_forwardTrue and False 1. There are no more than two separate phases to decision making and problem solving. 2. Every manager always has complete control over all inputs and factors. 3. Opportunity cost is only considered by accountants as a way to calculate profits 4. Standard error is always used to evaluate the overall strength of the regression model 5. The t-Stat is used in a similar way as the P-valued is used 6. The P-value is used as R-square is used. 7. R-square is used to evaluate the overall strength of the model. 8. Defining the problem is one of the last things that a manager considers Interpreting Regression Printouts (very brief answers) R² = .859 Intercept T N = 51 Coefficients 13.9 F= 306.5 Standard Error .139 SER=.1036 t Stat P value 99.8 0 .275 .0157 17.5 0 The above table examines the relationship between the nunber, of poor central city households in the U.S. and changes in the costs of college tuition from 1967 to 2019. 9. What is the direction of this relationship? 10.…arrow_forwardCARS Auto Co. Ltd – Alpha Branch Unadjusted Trial Balance December 31, 2024 A/C NAME TRIAL BALANCE DR CR cash 240,000 Accounts receivables 120,000 supplies 41,100 Lease hold improvement 200,000 Accumulated depreciation – Lease hold improvement 80,000 Furniture and fixtures 800,000 Accumulated depreciation - furniture and fixtures 380,000 Accounts payable 30,000 Salary payable Unearned service revenue 44,100 Cars, capital 649,000 Cars, withdrawal 165,100 Service revenue 450,000 Salary expense 48,400 Supplies expense Rent expense Depreciation expense – leasehold improvement Depreciation expense – furniture and fixtures Advertising expense 18,500 1,633,100 1,633,100 Data presented for the adjusting entries include the following: Rent expense of $160,000…arrow_forward
 Financial And Managerial AccountingAccountingISBN:9781337902663Author:WARREN, Carl S.Publisher:Cengage Learning,Century 21 Accounting Multicolumn JournalAccountingISBN:9781337679503Author:GilbertsonPublisher:Cengage
 Auditing: A Risk Based-Approach to Conducting a Q...AccountingISBN:9781305080577Author:Karla M Johnstone, Audrey A. Gramling, Larry E. RittenbergPublisher:South-Western College PubPrinciples of Accounting Volume 2AccountingISBN:9781947172609Author:OpenStaxPublisher:OpenStax College
 Managerial AccountingAccountingISBN:9781337912020Author:Carl Warren, Ph.d. Cma William B. TaylerPublisher:South-Western College Pub


