
MATLAB: An Introduction with Applications
6th Edition
ISBN: 9781119256830
Author: Amos Gilat
Publisher: John Wiley & Sons Inc
expand_more
expand_more
format_list_bulleted
Related questions
Topic Video
Question
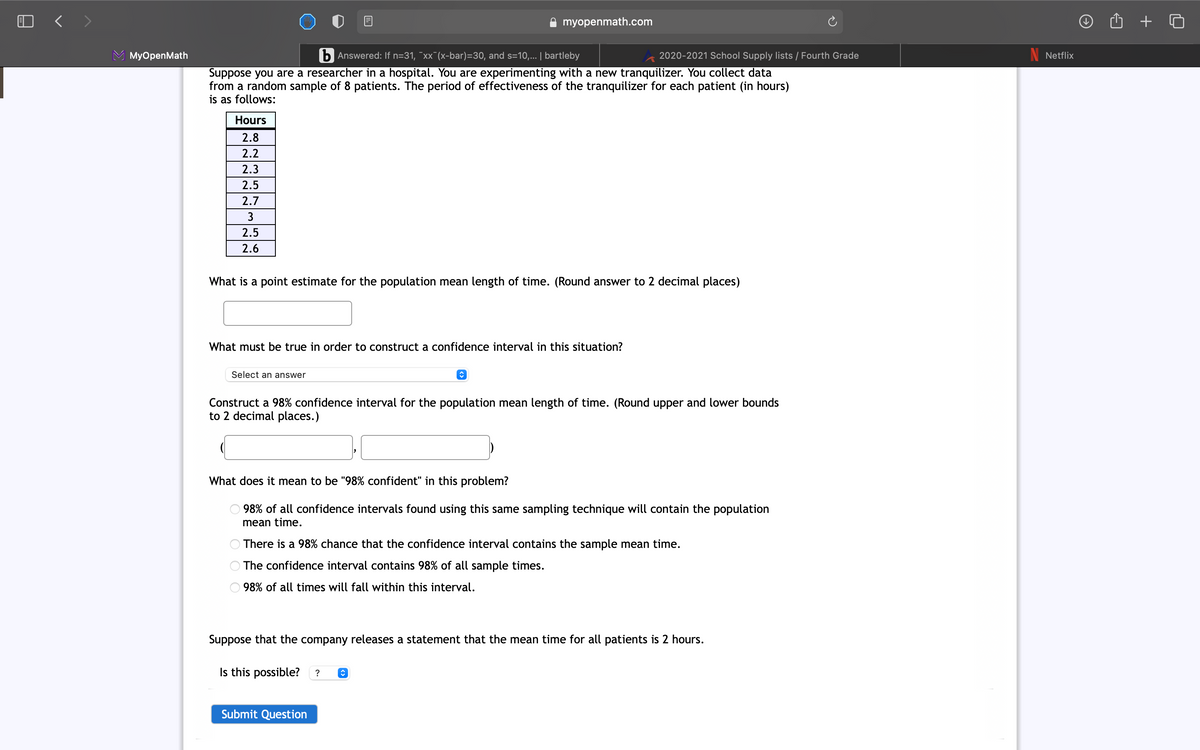

Transcribed Image Text:# Confidence Interval and Point Estimate Calculation
## Scenario
As a researcher in a hospital, you are testing a new tranquilizer. You have collected data from a random sample of 8 patients regarding the duration of the drug's effectiveness. The times recorded (in hours) are as follows:
| Hours |
|-------|
| 2.8 |
| 2.2 |
| 2.3 |
| 2.5 |
| 2.7 |
| 3.0 |
| 2.5 |
| 2.6 |
## Questions
1. **Point Estimate Calculation**
What is a point estimate for the population mean length of time? (Round your answer to 2 decimal places)
- Input box for the answer
2. **Requirements for Confidence Interval**
What must be true in order to construct a confidence interval in this situation?
- Dropdown menu for selecting the answer
3. **Confidence Interval Construction**
Construct a 98% confidence interval for the population mean length of time. (Round upper and lower bounds to 2 decimal places)
- Two input boxes for the lower and upper bounds
4. **Understanding Confidence Level**
What does it mean to be "98% confident" in this problem?
- Options:
- 98% of all confidence intervals found using this same sampling technique will contain the population mean time.
- There is a 98% chance that the confidence interval contains the sample mean time.
- The confidence interval contains 98% of all sample times.
- 98% of all times will fall within this interval.
5. **Company Statement**
Suppose the company releases a statement that the mean time for all patients is 2 hours. Is this possible?
- Dropdown menu for selecting the answer
- **Submit Button** for question submission
## Additional Notes
- For each step, ensure calculations are accurate.
- Use appropriate statistical methods for confidence interval estimation.
- Interpret the results clearly to understand the implications of the experiment findings.
Expert Solution
This question has been solved!
Explore an expertly crafted, step-by-step solution for a thorough understanding of key concepts.

This is a popular solution

Trending nowThis is a popular solution!

Step by stepSolved in 2 steps

Knowledge Booster


Learn more about
Need a deep-dive on the concept behind this application? Look no further. Learn more about this topic, statistics and related others by exploring similar questions and additional content below.Similar questions
- We wish to estimate what percent of adult residents in Ventura County like chocolate. Out of 500 adult residents sampled, 302 like chocolate. To construct a 90% confidence interval for the proportion (p) of adult residents who like chocolate in Ventura County, you need to use which one of the following calculator? O Hypothesis Test for a Population Mean Given Statistics O Hypothesis Test for a Population Proportion O Two Dependent Sample Means Comparison Given Data O Chi-Square Test for Independence O Confidence Interval for a Population Mean Given Statistics O Confidence Interval for a Population Proportion O Two Independent Proportions Comparison OTwo Independent Sample Means Comparison Given Data O Confidence Interval for a Population Mean Given Data O Chi-Square Test for Goodness of Fit One-Way ANOVA O Two Independent Sample Means Comparison Given Statistics O Hypothesis Test for a Population Mean Given Data a. Enter your answer as an open-interval (i.e., parentheses) using…arrow_forwardHow do you find a confidence interval of a population mean? I have included the questions.arrow_forwardLength of a confidence interval. Which confidence interval would be shorter, a confidence interval computed using a sample size of 90 or a confidence interval computed using a sample size of 900? Assume that the confidence level is 95% for both confidence intervals and that the only difference between them is the sample size. Explain your reasoning.arrow_forward
- If the analyst decides to increase the sample size (n) from 75 to 100, while maintaining the same confidence level, the width of the confidence interval would then: fluctuate up and down. remain unchanged. decrease. increase.arrow_forwardIn a recent survey of 1264 US adults, 26.6% said they had seen a ghost. What is the LOWER endpoint of a 98% confidence interval for the population proportion? What is the UPPER endpoint of a 98% confidence interval for the population proportion? Answers should be decimals (not percentages).arrow_forwardAn automotive manufacturer wants to know the proportion of new car buyers who prefer foreign cars over domestic. Step 1 of 2: Suppose a sample of 390 new car buyers is drawn. Of those sampled, 105 preferred foreign over domestic cars. Using the data, estimate the proportion of new car buyers who prefer foreign cars. Enter your answer as a fraction or a decimal number rounded to three decimal places. Answer(How to Enter) 2 Points 田 Tables E Keypadarrow_forward
arrow_back_ios
arrow_forward_ios
Recommended textbooks for you
- MATLAB: An Introduction with ApplicationsStatisticsISBN:9781119256830Author:Amos GilatPublisher:John Wiley & Sons Inc
 Probability and Statistics for Engineering and th...StatisticsISBN:9781305251809Author:Jay L. DevorePublisher:Cengage Learning
 Statistics for The Behavioral Sciences (MindTap C...StatisticsISBN:9781305504912Author:Frederick J Gravetter, Larry B. WallnauPublisher:Cengage Learning
  Elementary Statistics: Picturing the World (7th E...StatisticsISBN:9780134683416Author:Ron Larson, Betsy FarberPublisher:PEARSON
 The Basic Practice of StatisticsStatisticsISBN:9781319042578Author:David S. Moore, William I. Notz, Michael A. FlignerPublisher:W. H. Freeman
 Introduction to the Practice of StatisticsStatisticsISBN:9781319013387Author:David S. Moore, George P. McCabe, Bruce A. CraigPublisher:W. H. Freeman
MATLAB: An Introduction with Applications
Statistics
ISBN:9781119256830
Author:Amos Gilat
Publisher:John Wiley & Sons Inc
Probability and Statistics for Engineering and th...
Statistics
ISBN:9781305251809
Author:Jay L. Devore
Publisher:Cengage Learning
Statistics for The Behavioral Sciences (MindTap C...
Statistics
ISBN:9781305504912
Author:Frederick J Gravetter, Larry B. Wallnau
Publisher:Cengage Learning
Elementary Statistics: Picturing the World (7th E...
Statistics
ISBN:9780134683416
Author:Ron Larson, Betsy Farber
Publisher:PEARSON
The Basic Practice of Statistics
Statistics
ISBN:9781319042578
Author:David S. Moore, William I. Notz, Michael A. Fligner
Publisher:W. H. Freeman
Introduction to the Practice of Statistics
Statistics
ISBN:9781319013387
Author:David S. Moore, George P. McCabe, Bruce A. Craig
Publisher:W. H. Freeman