MATLAB: An Introduction with Applications
6th Edition
ISBN: 9781119256830
Author: Amos Gilat
Publisher: John Wiley & Sons Inc
expand_more
expand_more
format_list_bulleted
Question
thumb_up100%
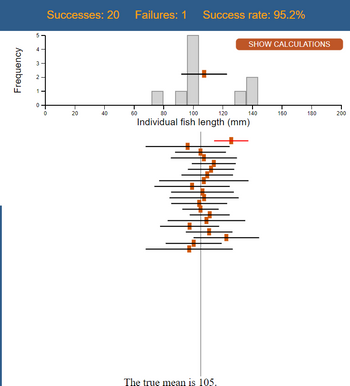
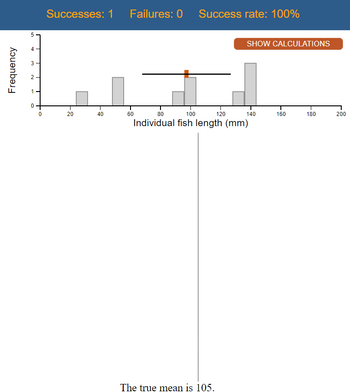
- How is the confidence interval and the point estimate for the population
mean visually shown? - How was a confidence interval that did NOT capture the population mean visually shown? How often would we expect this to occur?

Transcribed Image Text:Successes: 20 Failures: 1
5
SHOW CALCULATIONS
40
60
80
100
120
140
160
180
Individual fish length (mm)
A
Frequency
ترا
1
O
20
Success rate: 95.2%
The true mean is 105.
200

Transcribed Image Text:Frequency
5
4
3
تنا
2
1
0
L
0
Successes: 1 Failures: 0
SHOW CALCULATIONS
40
60
80
100
120
140
160
180
Individual fish length (mm)
20
Success rate: 100%
The true mean is 105.
200
Expert Solution
This question has been solved!
Explore an expertly crafted, step-by-step solution for a thorough understanding of key concepts.
Step by stepSolved in 2 steps

Knowledge Booster
Similar questions
- (c) What is the 95% confidence interval for the population mean score u based on this one sample? (Enter your answer rounded to one decimal place.) Lower value = Higher value =arrow_forwardcan you explain more in detail what you would input in excel for part 3. I keep getting an error message. Would the excel sheet look different if I don't include the 95% confidence intervalarrow_forwardTrue or False? To calculate the finalized n for a study, one should take the total number of participants needed to ensure the desired confidence interval and divide it by the proportion of individuals expected to be retained throughout the course of the study.arrow_forward
- Suppose a 90 percent confidence interval to estimate a population proportion was calculated from a sample proportion of 18 percent and a margin of error of 4 percent. What is the width of the confidence interval?arrow_forwardhow do I solve this problem?? I keep getting it incorrect and don't understand whyarrow_forwardSuppose we know that a confidence interval for a population proportion is (0.105,0.355), with a sample proportion of p̂=0.23. What is the margin of error?arrow_forward
- How much would we need to reduce the sample size in order to increase the width of a confidence interval by 50%? Show all calculations and interpret your answer in complete sentences. please explain with actual calculationarrow_forward8. A confidence interval for estimating the mean An industrial/organizational psychologist wants to improve worker productivity for a client firm, but first he needs to gain a better understanding of the life of the typical white-collar professional. Fortunately, he has access to the 2008 Workplace Productivity Survey, commissioned by LexisNexis and prepared by WorldOne Research, which surveyed a sample of 650 white-collar professionals (250 legal professionals and 400 other professionals). One of the survey questions was, “How many work-related emails do you receive during a typical workday?” For the subsample of legal professionals (n = 250), the mean response was M = 36.7 emails, with a sample standard deviation of s = 23.8 emails. The estimated standard error is sMM? = A-0.085, B-1.341, C-0.095 or D-1.505 (choices to choose from.) . Use the following Distributions tool to develop a 90% confidence interval estimate of the mean number of work-related emails legal…arrow_forwardIf a treatment is expected to increase scores on a variable for which the mean is expected to be µ = 100, what is the null hypothesis? µwith treatment > 100 µwith treatment < 100 µwith treatment > 100 µwith treatment < 100arrow_forward
- section 6.2, stats (help with TI-84 calculator is possible) The gas mileages (in miles per gallon) of 23 randomly selected sports cars are listed in the accompanying table. Assume the mileages are not normally distributed. Use the standard normal distribution or the t-distribution to construct a 90% confidence interval for the population mean. Justify your decision. If neither distribution can be used, explain why. Interpret the results. Here are the sports car mileage averages: 19,28,19,17,20,22,16,24,27.20,18,26,25,24,18,16,20,22,20,18,24,19,17 Let standard deviation stand for population standard deviation and let n be the sample size. which distribution should be used to construct the confidence interval? 1) A (t-distribution, the standard normal distribution should, or neither distribution can) be used to construct the confidence interval, since 2) is (stanard dev. and n greater than or equal to 10., standard is unknown and the population is not normally distributed.,…arrow_forwardDescribe a study in which you can use both nonparametric and parametric statistics. A researcher has participants expecting to receive either painful or mild electrical shocks during a study wait in a quarter-full waiting room with other participants. He then measures whether they choose to sit next to other participants or if they sit far away on their own. What is the best test to run for this study and why?arrow_forward8. A confidence interval for estimating the meanarrow_forward
arrow_back_ios
arrow_forward_ios
Recommended textbooks for you
 MATLAB: An Introduction with ApplicationsStatisticsISBN:9781119256830Author:Amos GilatPublisher:John Wiley & Sons Inc
 Probability and Statistics for Engineering and th...StatisticsISBN:9781305251809Author:Jay L. DevorePublisher:Cengage Learning
 Statistics for The Behavioral Sciences (MindTap C...StatisticsISBN:9781305504912Author:Frederick J Gravetter, Larry B. WallnauPublisher:Cengage Learning
 Elementary Statistics: Picturing the World (7th E...StatisticsISBN:9780134683416Author:Ron Larson, Betsy FarberPublisher:PEARSON
 The Basic Practice of StatisticsStatisticsISBN:9781319042578Author:David S. Moore, William I. Notz, Michael A. FlignerPublisher:W. H. Freeman
 Introduction to the Practice of StatisticsStatisticsISBN:9781319013387Author:David S. Moore, George P. McCabe, Bruce A. CraigPublisher:W. H. Freeman

MATLAB: An Introduction with Applications
Statistics
ISBN:9781119256830
Author:Amos Gilat
Publisher:John Wiley & Sons Inc

Probability and Statistics for Engineering and th...
Statistics
ISBN:9781305251809
Author:Jay L. Devore
Publisher:Cengage Learning

Statistics for The Behavioral Sciences (MindTap C...
Statistics
ISBN:9781305504912
Author:Frederick J Gravetter, Larry B. Wallnau
Publisher:Cengage Learning

Elementary Statistics: Picturing the World (7th E...
Statistics
ISBN:9780134683416
Author:Ron Larson, Betsy Farber
Publisher:PEARSON

The Basic Practice of Statistics
Statistics
ISBN:9781319042578
Author:David S. Moore, William I. Notz, Michael A. Fligner
Publisher:W. H. Freeman

Introduction to the Practice of Statistics
Statistics
ISBN:9781319013387
Author:David S. Moore, George P. McCabe, Bruce A. Craig
Publisher:W. H. Freeman