
MATLAB: An Introduction with Applications
6th Edition
ISBN: 9781119256830
Author: Amos Gilat
Publisher: John Wiley & Sons Inc
expand_more
expand_more
format_list_bulleted
Related questions
Question
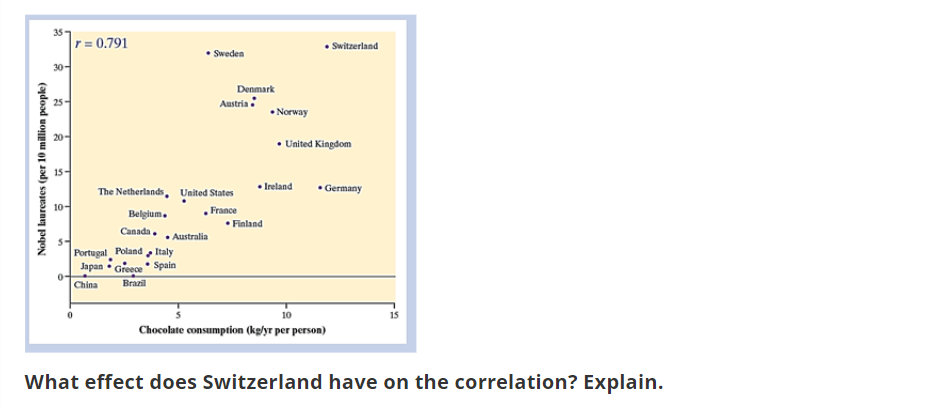

Transcribed Image Text:The image features a scatter plot graph representing the correlation between "Chocolate consumption (kg/yr per person)" on the x-axis and "Nobel laureates (per 10 million people)" on the y-axis. The graph shows data points for various countries, each represented by a blue dot and labeled with the country's name. The correlation coefficient \( r = 0.791 \) is indicated at the top left of the graph, suggesting a strong positive correlation between chocolate consumption and the number of Nobel laureates.
Countries generally follow a trend that suggests higher chocolate consumption is associated with a higher number of Nobel laureates, though with some variation. Switzerland is positioned as an outlier with notably high values for both chocolate consumption and Nobel laureates, compared to other countries.
**Analysis Question:**
What effect does Switzerland have on the correlation? Explain.
**Explanation:**
Switzerland, as an outlier, likely increases the correlation coefficient due to its high values in both variables, reinforcing the positive trend. Removing or altering its values could potentially lower the correlation, reflecting less association between chocolate consumption and Nobel laureates.
Expert Solution
This question has been solved!
Explore an expertly crafted, step-by-step solution for a thorough understanding of key concepts.

This is a popular solution

Trending nowThis is a popular solution!

Step by stepSolved in 2 steps

Knowledge Booster

Similar questions
- Fully explain the issues and problems with the below correlational data. Focus on the data in the highlighted box versus the rest of the data. Do not try to explain the data, but rather focus on the statistical issues and problems. IF YOU CAN'T SEE THE IMAGE HERE. PLEASE GO TO THIS LINK Linke 10 6. 8. 7. 5. 4. 10 20 30 40 50 60 70 80 90 100 Age Enjoyment of Hip-Hoparrow_forwardWhat is another possible explanation for this correlational relationship? Since this is just a correlation, we can’t be sure if age causes changes in your field goal percentage. So, what is one possible other explanation that you can come up with for the correlation that you calculated (hint: think about possible "third variable" explanations for this correlation---what other variables or factors might be causing changes in both x and y that could explain this correlation?).arrow_forwardWrite a research question that can be explained with a correlation a. Do you have an IV?b. Do you have a DV?arrow_forward
- What is another possible explanation for this correlational relationship? Since this is just a correlation, we can’t be sure if age causes changes in your field goal percentage. So, what is one possible other explanation that you can come up with for the correlation that you calculated (hint: think about possible "third variable" explanations for this correlation---what other variables or factors might be causing changes in both x and y that could explain this correlation?).arrow_forwardWhat is a reason why correlation does not imply causation? O Because correlations are not based on data. O Because you do not know if X or Y occurred first. O There could be a third variable that explains both X and Y. O Both b and carrow_forwardYou have data on the incidence of three types of malaria (A, B, and C) in three tropical regions (Africa, Asia, South America) . Is there a relationship between location and type of malaria? What is the appropriate test to answer this question? A Paired Samples t test B Correlation C Chi Square test D Independent Samples t testarrow_forward
- According to multiple research, there is a -0.697 correlation between happiness and loneliness. This means that _________. a. People who are happier tend to be less lonely. b. People who are happier tend to be more lonely. c. There is no link between happiness and loneliness. d. There is a causal relationship between happiness and loneliness.arrow_forwardWhich of the following is an appropriate research question for a correlation? Group of answer choices Is there a relationship between weather and mood? Does cold weather impact mood? Does drinking milkshakes make children happy? Does exercising reduce weight?arrow_forwardFind a best fit line for ice cream consumption and murders. This is a classic example of "spurious" correlation. Ice Cream 2,1,2,3,2,4,5,3,2,1,2,1 Murders 8,21,16,18,22,25,22,30,20,10,14,9arrow_forward
arrow_back_ios
arrow_forward_ios
Recommended textbooks for you
- MATLAB: An Introduction with ApplicationsStatisticsISBN:9781119256830Author:Amos GilatPublisher:John Wiley & Sons Inc
 Probability and Statistics for Engineering and th...StatisticsISBN:9781305251809Author:Jay L. DevorePublisher:Cengage Learning
 Statistics for The Behavioral Sciences (MindTap C...StatisticsISBN:9781305504912Author:Frederick J Gravetter, Larry B. WallnauPublisher:Cengage Learning
  Elementary Statistics: Picturing the World (7th E...StatisticsISBN:9780134683416Author:Ron Larson, Betsy FarberPublisher:PEARSON
 The Basic Practice of StatisticsStatisticsISBN:9781319042578Author:David S. Moore, William I. Notz, Michael A. FlignerPublisher:W. H. Freeman
 Introduction to the Practice of StatisticsStatisticsISBN:9781319013387Author:David S. Moore, George P. McCabe, Bruce A. CraigPublisher:W. H. Freeman
MATLAB: An Introduction with Applications
Statistics
ISBN:9781119256830
Author:Amos Gilat
Publisher:John Wiley & Sons Inc
Probability and Statistics for Engineering and th...
Statistics
ISBN:9781305251809
Author:Jay L. Devore
Publisher:Cengage Learning
Statistics for The Behavioral Sciences (MindTap C...
Statistics
ISBN:9781305504912
Author:Frederick J Gravetter, Larry B. Wallnau
Publisher:Cengage Learning
Elementary Statistics: Picturing the World (7th E...
Statistics
ISBN:9780134683416
Author:Ron Larson, Betsy Farber
Publisher:PEARSON
The Basic Practice of Statistics
Statistics
ISBN:9781319042578
Author:David S. Moore, William I. Notz, Michael A. Fligner
Publisher:W. H. Freeman
Introduction to the Practice of Statistics
Statistics
ISBN:9781319013387
Author:David S. Moore, George P. McCabe, Bruce A. Craig
Publisher:W. H. Freeman