MATLAB: An Introduction with Applications
6th Edition
ISBN: 9781119256830
Author: Amos Gilat
Publisher: John Wiley & Sons Inc
expand_more
expand_more
format_list_bulleted
Question
What is another possible explanation for this correlational relationship? Since this is just a

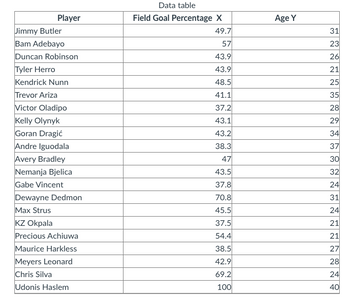
Transcribed Image Text:**Data Table: Player Statistics**
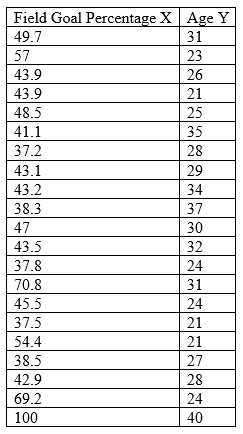
| Player | Field Goal Percentage (X) | Age (Y) |
|-------------------|---------------------------|---------|
| Jimmy Butler | 49.7 | 31 |
| Bam Adebayo | 57 | 23 |
| Duncan Robinson | 43.9 | 26 |
| Tyler Herro | 43.9 | 21 |
| Kendrick Nunn | 48.5 | 25 |
| Trevor Ariza | 41.1 | 35 |
| Victor Oladipo | 37.2 | 28 |
| Kelly Olynyk | 43.1 | 29 |
| Goran Dragić | 43.2 | 34 |
| Andre Iguodala | 38.3 | 37 |
| Avery Bradley | 47 | 30 |
| Nemanja Bjelica | 43.5 | 32 |
| Gabe Vincent | 37.8 | 24 |
| Dewayne Dedmon | 70.8 | 31 |
| Max Strus | 45.5 | 24 |
| KZ Okpala | 37.5 | 21 |
| Precious Achiuwa | 54.4 | 21 |
| Maurice Harkless | 38.5 | 27 |
| Meyers Leonard | 42.9 | 28 |
| Chris Silva | 69.2 | 24 |
| Udonis Haslem | 100 | 40 |
**Explanation:**
This table presents data on various basketball players, listing their field goal percentages and ages. Each player is identified by their name, with two corresponding data columns:
1. **Field Goal Percentage (X):** This column indicates the player's shooting accuracy, represented as a percentage of successful shots made from the field.
2. **Age (Y):** This column shows the player's age, which might influence performance and experience.
The table can be used for analyzing correlations between shooting accuracy and age among these players. Note that "Udonis Haslem" has a field goal percentage listed as 100, which may be an
Expert Solution
arrow_forward
Step 1
Solution:
From the given information,

Step by stepSolved in 2 steps with 4 images

Knowledge Booster
Similar questions
- You calculate a correlation coefficient of -0.8 for the two characteristics of eating a particular fruit and having a particular level of blood cholesterol. What can you conclude? There is not enough information in this question to provide an answer. The more of this fruit you eat, the lower your blood cholesterol will be. There is no correlation between eating this fruit and having a particular level of blood cholesterol. The more of this fruit you eat, the higher your blood cholesterol will be. There is a correlation between eating this fruit and having a particular blood cholesterol, but the value of 0.8 is too low to draw any conclusions.arrow_forwardA statement is made about correlation. State whether the correlation is positive or negative and whether the correlation is most likely due to coincidence, a common underlying cause, or a direct cause. If there is an underlying cause, state what the underlying cause is. If one directly causes the other, state which is the cause and which is the effect.(a) In Angela's class, the taller students got lower scores on the test.(b) As Thomas's income rose over the last 20 years so has his stress level.arrow_forwardIf we find that there is a linear correlation between the concentration of carbon dioxide in our atmosphere and the global temperature, does that indicate that changes in the concentration of carbon dioxide cause changes in the global temperature? Choose the correct answer below. A. No. The presence of a linear correlation between two variables does not imply that one of the variables is the cause of the other variable. B. Yes. The presence of a linear correlation between two variables implies that one of the variables is the cause of the other variable.arrow_forward
- In general, a zero correlation means as the values of one variable increase, there is a tendency for the values of the other variable also to increase. as the values of one variable increase, there is a tendency for the values of the other variableto decrease. as the values of one variable increase, there is no tendency for the values of the other variable to change in any consistent, predictable fashion. as the values of one variable decrease, there is a tendency for the values of the other variable also to decrease.arrow_forwardChuck has noticed over the last several years that as he gets older, he also gets more politically conservative. What is the correlation between his age and his conservative leanings?Positive Negative Impossible to Determine ( don't hand writing solution)arrow_forwardA phrase often repeated in this class is "correlation is not causation". Which of the following best describes what this phrase means? Correlation is not causation means that just because two values appear to be related on a graph doesn't mean that one necessarily causes the other. Correlation is not causation means that when we see values that move together (e.g. ice cream sales and murder rates), we can assume that one must be causing the other. Correlation is not causation means that if values move in opposite directions (e.g. average temperature goes down and grades go up), we can assume that one must influence to the other. O Correlation is not causation means that when values are shown to be related in a graph, this is proof that they are not causal.arrow_forward
- Answer the following questions with complete sentences. When you have finished everything, submit the lab to 'Assignments' folder of Blackboard by Friday, April 10t by 11:59 pm. Imagine a researcher found a positive correlation between two variables, and reported that the r value was +.3. One possibility is that there is a true correlation between these two variables. Discuss one alternative possibility that would alsoarrow_forwardThe following statement contains an error. Choose the statement that best explains the error. "The correlation between shoe size and height is 0.87 inches" A. Correlation requires that both of the variables be categorical B. When stating the correlation coefficient, one must state whether it is a positive or negative relationship C. This statement does not tell us whether or not shoe size is correlated with height D. When reporting correlation, one does not report units because correlation has no units E. There is no error in this statementarrow_forwardIf when measuring two quantitative variables on an individual, we find that increases in the first variable x correspond to decreases in the second variable y, we say that A. there is a positive association between the two variables. b. there is a negative association between the two variables. c. there is no correlation between the two variables. d. there is a cause-and-effect relationship between the two variables.arrow_forward
- What is another possible explanation for this correlational relationship? Since this is just a correlation, we can’t be sure if age causes changes in your field goal percentage. So, what is one possible other explanation that you can come up with for the correlation that you calculated (hint: think about possible "third variable" explanations for this correlation---what other variables or factors might be causing changes in both x and y that could explain this correlation?).arrow_forwardIf we find that there is a linear correlation between the concentration of carbon dioxide in our atmosphere and the global temperature, does that indicate that changes in the concentration of carbon dioxide cause changes in the global temperature? Choose the correct answer below. A. No. The presence of a linear correlation between two variables does not imply that one of the variables is the cause of the other variable. B. Yes. The presence of a linear correlation between two variables implies that one of the variables is the cause of the other variable.arrow_forwardSuppose that two variables, x and y, have a correlation coefficient of −0.77. Which of the following statements are true? You must make a selection for each option. Click once to place a check mark for correct answers and click twice to empty the box for the wrong answers. check all that apply There is a strong relationship between these two variables. As x increases, y decreases. The variables have a negative linear relationship. As x increases, y increases. There is a weak relationship between these two variables.arrow_forward
arrow_back_ios
SEE MORE QUESTIONS
arrow_forward_ios
Recommended textbooks for you
 MATLAB: An Introduction with ApplicationsStatisticsISBN:9781119256830Author:Amos GilatPublisher:John Wiley & Sons Inc
 Probability and Statistics for Engineering and th...StatisticsISBN:9781305251809Author:Jay L. DevorePublisher:Cengage Learning
 Statistics for The Behavioral Sciences (MindTap C...StatisticsISBN:9781305504912Author:Frederick J Gravetter, Larry B. WallnauPublisher:Cengage Learning
 Elementary Statistics: Picturing the World (7th E...StatisticsISBN:9780134683416Author:Ron Larson, Betsy FarberPublisher:PEARSON
 The Basic Practice of StatisticsStatisticsISBN:9781319042578Author:David S. Moore, William I. Notz, Michael A. FlignerPublisher:W. H. Freeman
 Introduction to the Practice of StatisticsStatisticsISBN:9781319013387Author:David S. Moore, George P. McCabe, Bruce A. CraigPublisher:W. H. Freeman

MATLAB: An Introduction with Applications
Statistics
ISBN:9781119256830
Author:Amos Gilat
Publisher:John Wiley & Sons Inc

Probability and Statistics for Engineering and th...
Statistics
ISBN:9781305251809
Author:Jay L. Devore
Publisher:Cengage Learning

Statistics for The Behavioral Sciences (MindTap C...
Statistics
ISBN:9781305504912
Author:Frederick J Gravetter, Larry B. Wallnau
Publisher:Cengage Learning

Elementary Statistics: Picturing the World (7th E...
Statistics
ISBN:9780134683416
Author:Ron Larson, Betsy Farber
Publisher:PEARSON

The Basic Practice of Statistics
Statistics
ISBN:9781319042578
Author:David S. Moore, William I. Notz, Michael A. Fligner
Publisher:W. H. Freeman

Introduction to the Practice of Statistics
Statistics
ISBN:9781319013387
Author:David S. Moore, George P. McCabe, Bruce A. Craig
Publisher:W. H. Freeman