We learned how to create Pivot Tables, Calculations, and Slicers. Using the data below: Part A - Create a Pivot table that shows in aggregate form the Product, Average Number of Units sold (0 decimals), Total Sales (2 decimals), and % of Total Sales (1 decimal). Insert a Timeline by Months. Part B - Create a Pivot table that shows in aggregate form the Products in the rows, the Locations in the Columns, and the Number of Transactions (not Units) for each. (0 decimals) Group the Products eye liner and mascara and rename it "eye products" and Group the Products lip gloss and lipstick and rename it "lip products". Tum off all Subtotals (see Design menu). Part C - Create a Pivot table that shows in aggregate form the Salesperson in the rows, the Location in the Columns, and the Average Total Sales (2 decimals) for each. Then create a Pivot Chart in the form of a Line Chart with Markers making the x axis Products and they axis Average Total Sales with a Line for each Location. The y axis should show a minimum of $120 and a maximum of $220 in $5 increments. HINT-You will need to change the format of the y-axis. Part D - Create a Pivot table that shows Total Units (0 decimals) by Location, and Product. Insert two Slicers so the Pivot Table can be filtered by Salesperson and Product. Part E - Create a Pivot table that shows in aggregate form the Salesperson, Total Sales (0 decimals), and Sales per Unit (2 decimals). HINT-You will need to create a calculated field. Trans Numbe 1 2 3 4 5 6 7 8 9 10 11 12 13 14 15 16 17 18 19 20 21 22 23 24 25 26 27 28 29 30 31 32 33 34 35 36 37 38 39 40 41 42 Salespersor Betsy Hallagan Ashley Hallagan Zaret Colleen Cristina Colleen Ashley Betsy Ashley Ashley Emilee Hallagan Zaret Emilee Colleen Jen Jen Zaret Zaret Betsy Colleen Emilee Jen Cristina Cristina Cici Zaret Cici Hallagan Emilee Emilee Betsy Colleen Emilee Ashley Zaret Emilee Betsy Zaret Zaret Location south midwest midwest west midwest midwest midwest midwest south east east west west south east east south midwest south midwest west midwest midwest west midwest midwest midwest west west west south south midwest west midwest east east west south west west midwest Date ▾ Product 4/1/04 lip gloss 3/10/04 foundation 2/25/05 lipstick 5/22/06 lip gloss 6/17/04 lip gloss 11/27/05 eye liner 3/21/04 eye liner 12/17/06 lip gloss 7/5/06 eye liner 8/7/06 lip gloss 11/29/04 mascara 11/18/04 lip gloss 8/31/05 lip gloss 1/1/05 eye liner 9/20/06 foundation 4/12/04 mascara 4/30/06 mascara 8/31/05 lip gloss 10/27/04 eye liner 11/27/05 lip gloss 6/2/06 mascara 9/24/04 eye liner 2/1/06 mascara 12/6/06 lip gloss 4/12/04 lipstick 9/22/05 foundation 3/28/06 lip gloss 6/17/04 mascara 9/9/06 mascara 2/23/06 foundation 6/24/06 foundation 2/6/04 eye liner 4/10/05 mascara 4/1/04 foundation 6/6/04 lip gloss 9/20/06 lip gloss 8/9/05 mascara 9/24/04 eye liner 5/24/05 eye liner 11/18/04 foundation 11/18/04 lip gloss 6/15/05 eye liner Units 50 55 14 60 48 63 13 77 80 29 48 28 54 23 -3 50 71 93 83 62 17 33 30 29 43 82 58 46 24 -4 43 30 24 91 60 7 98 19 42 68 6 29 Dollars $164.64 $182.41 $34.46 $236.48 $156.72 $211.19 $30.96 $297.41 $271.97 $88.20 $157.01 $85.24 $179.51 $187.76 -$26.39 $284.87 $359.58 $438.23 $283.38 $207.74 $45.70 $103.81 $92.77 $89.54 $139.19 $279.66 $193.75 $150.32 $70.98 -$29.56 $138.70 $91.87 $71.26 $311.83 $200.54 $9.42 $336.83 $52.72 $135.64 $228.84 $6.72 $88.32 0
We learned how to create Pivot Tables, Calculations, and Slicers. Using the data below: Part A - Create a Pivot table that shows in aggregate form the Product, Average Number of Units sold (0 decimals), Total Sales (2 decimals), and % of Total Sales (1 decimal). Insert a Timeline by Months. Part B - Create a Pivot table that shows in aggregate form the Products in the rows, the Locations in the Columns, and the Number of Transactions (not Units) for each. (0 decimals) Group the Products eye liner and mascara and rename it "eye products" and Group the Products lip gloss and lipstick and rename it "lip products". Tum off all Subtotals (see Design menu). Part C - Create a Pivot table that shows in aggregate form the Salesperson in the rows, the Location in the Columns, and the Average Total Sales (2 decimals) for each. Then create a Pivot Chart in the form of a Line Chart with Markers making the x axis Products and they axis Average Total Sales with a Line for each Location. The y axis should show a minimum of $120 and a maximum of $220 in $5 increments. HINT-You will need to change the format of the y-axis. Part D - Create a Pivot table that shows Total Units (0 decimals) by Location, and Product. Insert two Slicers so the Pivot Table can be filtered by Salesperson and Product. Part E - Create a Pivot table that shows in aggregate form the Salesperson, Total Sales (0 decimals), and Sales per Unit (2 decimals). HINT-You will need to create a calculated field. Trans Numbe 1 2 3 4 5 6 7 8 9 10 11 12 13 14 15 16 17 18 19 20 21 22 23 24 25 26 27 28 29 30 31 32 33 34 35 36 37 38 39 40 41 42 Salespersor Betsy Hallagan Ashley Hallagan Zaret Colleen Cristina Colleen Ashley Betsy Ashley Ashley Emilee Hallagan Zaret Emilee Colleen Jen Jen Zaret Zaret Betsy Colleen Emilee Jen Cristina Cristina Cici Zaret Cici Hallagan Emilee Emilee Betsy Colleen Emilee Ashley Zaret Emilee Betsy Zaret Zaret Location south midwest midwest west midwest midwest midwest midwest south east east west west south east east south midwest south midwest west midwest midwest west midwest midwest midwest west west west south south midwest west midwest east east west south west west midwest Date ▾ Product 4/1/04 lip gloss 3/10/04 foundation 2/25/05 lipstick 5/22/06 lip gloss 6/17/04 lip gloss 11/27/05 eye liner 3/21/04 eye liner 12/17/06 lip gloss 7/5/06 eye liner 8/7/06 lip gloss 11/29/04 mascara 11/18/04 lip gloss 8/31/05 lip gloss 1/1/05 eye liner 9/20/06 foundation 4/12/04 mascara 4/30/06 mascara 8/31/05 lip gloss 10/27/04 eye liner 11/27/05 lip gloss 6/2/06 mascara 9/24/04 eye liner 2/1/06 mascara 12/6/06 lip gloss 4/12/04 lipstick 9/22/05 foundation 3/28/06 lip gloss 6/17/04 mascara 9/9/06 mascara 2/23/06 foundation 6/24/06 foundation 2/6/04 eye liner 4/10/05 mascara 4/1/04 foundation 6/6/04 lip gloss 9/20/06 lip gloss 8/9/05 mascara 9/24/04 eye liner 5/24/05 eye liner 11/18/04 foundation 11/18/04 lip gloss 6/15/05 eye liner Units 50 55 14 60 48 63 13 77 80 29 48 28 54 23 -3 50 71 93 83 62 17 33 30 29 43 82 58 46 24 -4 43 30 24 91 60 7 98 19 42 68 6 29 Dollars $164.64 $182.41 $34.46 $236.48 $156.72 $211.19 $30.96 $297.41 $271.97 $88.20 $157.01 $85.24 $179.51 $187.76 -$26.39 $284.87 $359.58 $438.23 $283.38 $207.74 $45.70 $103.81 $92.77 $89.54 $139.19 $279.66 $193.75 $150.32 $70.98 -$29.56 $138.70 $91.87 $71.26 $311.83 $200.54 $9.42 $336.83 $52.72 $135.64 $228.84 $6.72 $88.32 0

Chapter19: Pricing Concepts
Section: Chapter Questions
Problem 6DRQ

Related questions
Question
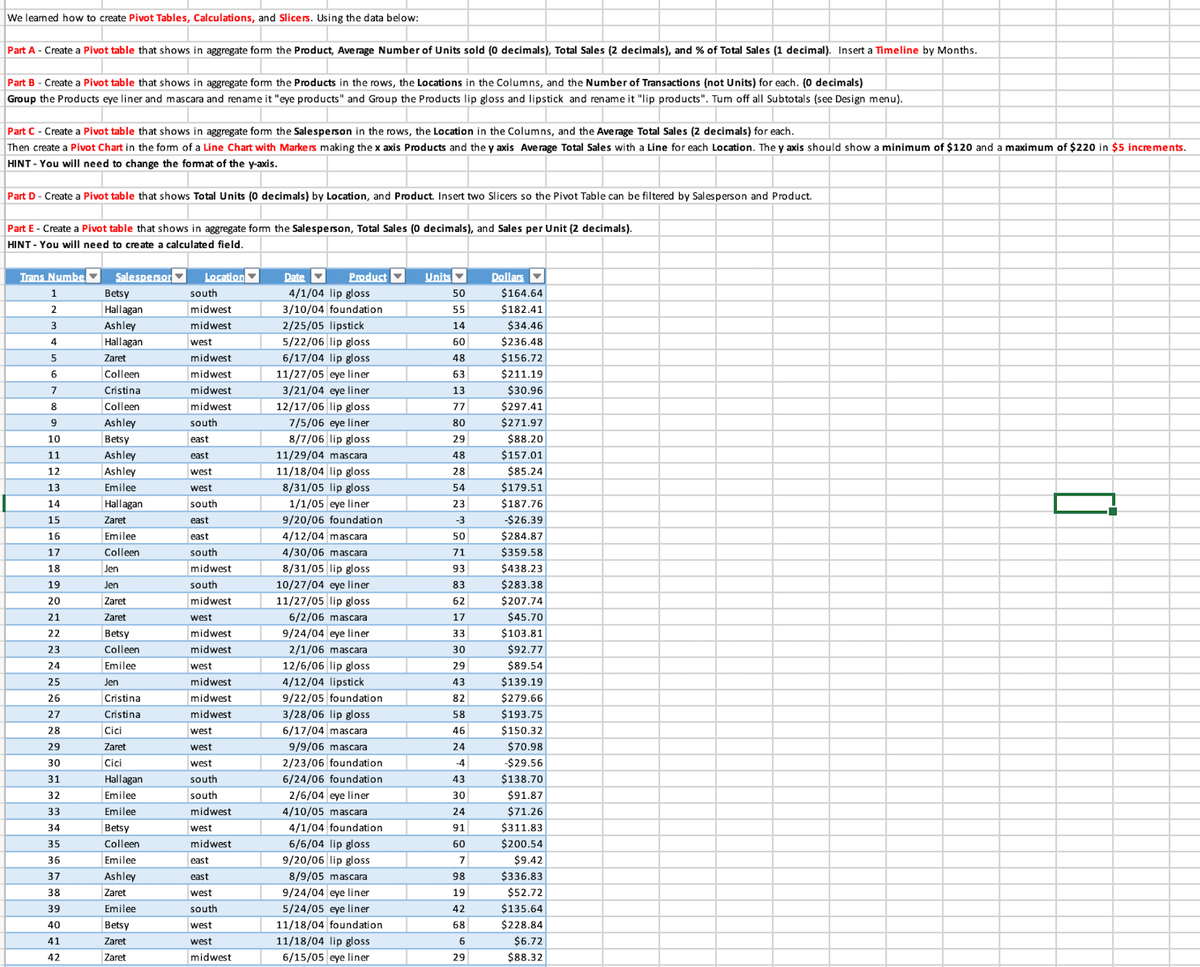
Transcribed Image Text:We learned how to create Pivot Tables, Calculations, and Slicers. Using the data below:
Part A - Create a Pivot table that shows in aggregate form the Product, Average Number of Units sold (0 decimals), Total Sales (2 decimals), and % of Total Sales (1 decimal). Insert a Timeline by Months.
Part B - Create a Pivot table that shows in aggregate form the Products in the rows, the Locations in the Columns, and the Number of Transactions (not Units) for each. (0 decimals)
Group the Products eye liner and mascara and rename it "eye products" and Group the Products lip gloss and lipstick and rename it "lip products". Tum off all Subtotals (see Design menu).
Part C - Create a Pivot table that shows in aggregate form the Salesperson in the rows, the Location in the Columns, and the Average Total Sales (2 decimals) for each.
Then create a Pivot Chart in the form of a Line Chart with Markers making the x axis Products and they axis Average Total Sales with a Line for each Location. The y axis should show a minimum of $120 and a maximum of $220 in $5 increments.
HINT-You will need to change the format of the y-axis.
Part D - Create a Pivot table that shows Total Units (0 decimals) by Location, and Product. Insert two Slicers so the Pivot Table can be filtered by Salesperson and Product.
Part E - Create a Pivot table that shows in aggregate form the Salesperson, Total Sales (0 decimals), and Sales per Unit (2 decimals).
HINT-You will need to create a calculated field.
Trans Numbe
1
2
3
4
5
6
7
8
9
10
11
12
13
14
15
16
17
18
19
20
21
22
23
24
25
26
27
28
29
30
31
32
33
34
35
36
37
38
39
40
41
42
Salespersor
Betsy
Hallagan
Ashley
Hallagan
Zaret
Colleen
Cristina
Colleen
Ashley
Betsy
Ashley
Ashley
Emilee
Hallagan
Zaret
Emilee
Colleen
Jen
Jen
Zaret
Zaret
Betsy
Colleen
Emilee
Jen
Cristina
Cristina
Cici
Zaret
Cici
Hallagan
Emilee
Emilee
Betsy
Colleen
Emilee
Ashley
Zaret
Emilee
Betsy
Zaret
Zaret
Location
south
midwest
midwest
west
midwest
midwest
midwest
midwest
south
east
east
west
west
south
east
east
south
midwest
south
midwest
west
midwest
midwest
west
midwest
midwest
midwest
west
west
west
south
south
midwest
west
midwest
east
east
west
south
west
west
midwest
Date ▾ Product
4/1/04 lip gloss
3/10/04 foundation
2/25/05 lipstick
5/22/06 lip gloss
6/17/04 lip gloss
11/27/05 eye liner
3/21/04 eye liner
12/17/06 lip gloss
7/5/06 eye liner
8/7/06 lip gloss
11/29/04 mascara
11/18/04 lip gloss
8/31/05 lip gloss
1/1/05 eye liner
9/20/06 foundation
4/12/04 mascara
4/30/06 mascara
8/31/05 lip gloss
10/27/04 eye liner
11/27/05 lip gloss
6/2/06 mascara
9/24/04 eye liner
2/1/06 mascara
12/6/06 lip gloss
4/12/04 lipstick
9/22/05 foundation
3/28/06 lip gloss
6/17/04 mascara
9/9/06 mascara
2/23/06 foundation
6/24/06 foundation
2/6/04 eye liner
4/10/05 mascara
4/1/04 foundation
6/6/04 lip gloss
9/20/06 lip gloss
8/9/05 mascara
9/24/04 eye liner
5/24/05 eye liner
11/18/04 foundation
11/18/04 lip gloss
6/15/05 eye liner
Units
50
55
14
60
48
63
13
77
80
29
48
28
54
23
-3
50
71
93
83
62
17
33
30
29
43
82
58
46
24
-4
43
30
24
91
60
7
98
19
42
68
6
29
Dollars
$164.64
$182.41
$34.46
$236.48
$156.72
$211.19
$30.96
$297.41
$271.97
$88.20
$157.01
$85.24
$179.51
$187.76
-$26.39
$284.87
$359.58
$438.23
$283.38
$207.74
$45.70
$103.81
$92.77
$89.54
$139.19
$279.66
$193.75
$150.32
$70.98
-$29.56
$138.70
$91.87
$71.26
$311.83
$200.54
$9.42
$336.83
$52.72
$135.64
$228.84
$6.72
$88.32
0
AI-Generated Solution

Unlock instant AI solutions
Tap the button
to generate a solution