Principles of Economics 2e
2nd Edition
ISBN: 9781947172364
Author: Steven A. Greenlaw; David Shapiro
Publisher: OpenStax
expand_more
expand_more
format_list_bulleted
Question
Step by Step solution please

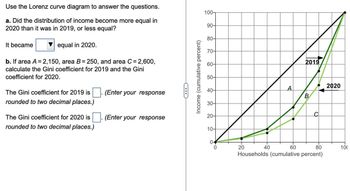
Transcribed Image Text:Use the Lorenz curve diagram to answer the questions.
a. Did the distribution of income become more equal in
2020 than it was in 2019, or less equal?
It became
equal in 2020.
b. If area A = 2,150, area B = 250, and area C = 2,600,
calculate the Gini coefficient for 2019 and the Gini
coefficient for 2020.
The Gini coefficient for 2019 is
rounded to two decimal places.)
The Gini coefficient for 2020 is
rounded to two decimal places.)
(Enter your response
(Enter your response
☐☐☐
Income (cumulative percent)
100-
90-
80-
70-
60-
2019
50-
2020
40-
A
B
30-
20-
10-
0
0
20
40
60
80
100
Households (cumulative percent)
Expert Solution
This question has been solved!
Explore an expertly crafted, step-by-step solution for a thorough understanding of key concepts.
Step by stepSolved in 2 steps

Knowledge Booster
Similar questions
- If a country had perfect income equality what would the Lorenz curve look like?arrow_forwardTo reduce income inequality, should the marginal tax rates on the top 1 be increased?arrow_forwardDescribe how a push for economic equality might reduce incentives to work and produce output. Then describe how a push for economic inequality might nut have such effects.arrow_forward
- What are some reasons why a certain degree of inequality of income would be expected in a market economy?arrow_forwardExplain how a country may experience greater equality in the distribution of income, yet still experience high rates of poverty. Hint: Look at the Clear It Up 'How do governments measure poverty in low-income countries?' and compare to Table 15.5.arrow_forwardHow does the TANF attempt to loosen the poverty trap?arrow_forward
- What do you think is more important to focus on when considering inequality: income inequality or wealth inequality?arrow_forwardIf a family of three earned 20,000, would they be able to make ends meet given the official poverty threshold?arrow_forwardThe following income distribution data are for Brazil. Quintile Percent Share Lowest 20% 3.0% Second quintile 6.9% Third quintile 11.8% Fourth quintile 19.6% Highest 20% 58.7% Highest 10% 43.0% a. Carefully graph the Lorenz curve, labeling the axes. b. Brazil’s national income is about $300 billion. What is the approximate dollar income of the bottom 20%? Bottom 40%?arrow_forward
- A Lorenz curve is a graph whose axes measure the: a. total amount of income in dollars on one axis and the total number of individuals or families receiving that income or a lower one on the other. b. percentage of people (10 percent, 20 percent, etc.) on one axis and the percentage of total income received by the lowest 10 percent, the lowest 20 percent, etc., on the other. c. number of individuals or families receiving a certain income on one axis and the percentage of the total population represented by that number on the other. d. number of individuals or families in different occupations on one axis and the median income received in that occupation on the other. e. income classes (e.g., $0 to $1999 and $2000 to $3999) on one axis and the percentage of individuals or families in each such income class on the other.arrow_forward1. An economy's Lorenz Curve reveals that an economy's highest income quintile has 65% of the economy's income while the lowest income quintile only has 5% of the economy's income. Solely based on the Lorenz Curve, is this distribution of income fair? Why or why not? 2. To combat income inequality and to generate increased tax revenues to fund expenditures, government officials decide to aggressively increase how progressive income taxes are, so much so that the top income earners are marginally taxed 90% of their income (and while this marginal tax rate may seem oppressive, these top income earners still have more than enough income to satisfy all of their needs and all but the most extravagant of wants - basically, these earners have more than enough money). Argue why this tax policy is a fair approach to fund government expenditures. Why might this tax policy fail to achieve its objectives (tax revenues would actually decline as a result)?arrow_forward2arrow_forward
arrow_back_ios
SEE MORE QUESTIONS
arrow_forward_ios
Recommended textbooks for you
 Principles of Economics 2eEconomicsISBN:9781947172364Author:Steven A. Greenlaw; David ShapiroPublisher:OpenStax

 Principles of MicroeconomicsEconomicsISBN:9781305156050Author:N. Gregory MankiwPublisher:Cengage Learning
 Economics (MindTap Course List)EconomicsISBN:9781337617383Author:Roger A. ArnoldPublisher:Cengage Learning

Principles of Economics 2e
Economics
ISBN:9781947172364
Author:Steven A. Greenlaw; David Shapiro
Publisher:OpenStax


Principles of Microeconomics
Economics
ISBN:9781305156050
Author:N. Gregory Mankiw
Publisher:Cengage Learning

Economics (MindTap Course List)
Economics
ISBN:9781337617383
Author:Roger A. Arnold
Publisher:Cengage Learning
